ADT 2007 Annual Report Download - page 73
Download and view the complete annual report
Please find page 73 of the 2007 ADT annual report below. You can navigate through the pages in the report by either clicking on the pages listed below, or by using the keyword search tool below to find specific information within the annual report.-
 1
1 -
2
-
3
-
4
-
5
-
6
-
7
-
8
-
9
-
10
-
11
-
12
-
13
-
14
-
15
-
16
-
17
-
18
-
19
-
20
-
21
-
22
-
23
-
24
-
25
-
26
-
27
-
28
-
29
-
30
-
31
-
32
-
33
-
34
-
35
-
36
-
37
-
38
-
39
-
40
-
41
-
42
-
43
-
44
-
45
-
46
-
47
-
48
-
49
-
50
-
51
-
52
-
53
-
54
-
55
-
56
-
57
-
58
-
59
-
60
-
61
-
62
-
 63
63 -
 64
64 -
 65
65 -
 66
66 -
 67
67 -
 68
68 -
 69
69 -
 70
70 -
 71
71 -
 72
72 -
 73
73 -
 74
74 -
 75
75 -
 76
76 -
 77
77 -
 78
78 -
 79
79 -
 80
80 -
 81
81 -
 82
82 -
 83
83 -
84
-
85
-
86
-
87
-
88
-
89
-
90
-
91
-
92
-
93
-
94
-
95
-
96
-
97
-
98
-
99
-
100
-
101
-
102
-
103
-
104
-
105
-
106
-
107
-
108
-
109
-
110
-
111
-
112
-
113
-
114
-
115
-
116
-
117
-
118
-
119
-
120
-
121
-
122
-
123
-
124
-
125
-
126
-
127
-
128
-
129
-
130
-
131
-
132
-
133
-
134
-
135
-
136
-
137
-
138
-
139
-
140
-
141
-
142
-
143
-
144
-
145
-
146
-
147
-
148
-
149
-
150
-
151
-
152
-
153
-
154
-
155
-
156
-
157
-
158
-
159
-
160
-
161
-
162
-
163
-
164
-
165
-
166
-
167
-
168
-
169
-
170
-
171
-
172
-
173
-
174
-
175
-
176
-
177
-
178
-
179
-
180
-
181
-
182
-
183
-
184
-
185
-
186
-
187
-
188
-
189
-
190
-
191
-
192
-
193
-
194
-
195
-
196
-
197
-
198
-
199
-
200
-
201
-
202
-
203
-
204
-
205
-
206
-
207
-
208
-
209
-
210
-
211
-
212
-
213
-
214
-
215
-
216
-
217
-
218
-
219
-
220
-
221
-
222
-
223
-
224
-
225
-
226
-
227
-
228
-
229
-
230
-
231
-
232
-
233
-
234
-
235
-
236
-
237
-
238
-
239
-
240
-
241
-
242
-
243
-
244
-
245
-
246
-
247
-
248
-
249
-
250
-
251
-
252
-
253
-
254
-
255
-
256
-
257
-
258
-
259
-
260
-
261
-
262
-
263
-
264
-
265
-
266
-
267
-
268
-
269
-
270
-
271
-
272
-
273
-
274
 |
 |

2008 Proxy Statement 53
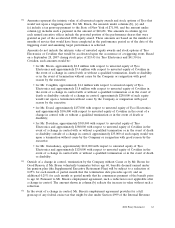
All Other
Stock All Other Grant
Estimated Possible Payouts Estimated Possible Payouts Awards: Option Date
Under Non-Equity Incentive Plan Under Equity Incentive Plan Number of Awards: Exercise or Fair Value
Awards(2) Awards(3) Shares Number of Base of Stock
Board or Target of Stock Securities Price of and
Committee (Mid- or Underlying Option Option
Grant Approval Threshold Target Maximum Threshold Point) Maximum Units(4) Options(4) Awards(5) Awards
Name Date Date(1) ($) ($) ($) ($) ($) ($) (#) (#) ($/Sh) ($)
(a) (b) (c) (d) (e) (f) (g) (h) (i) (j) (k) (l) (n)
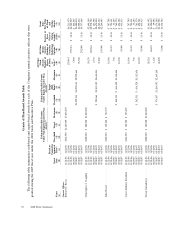
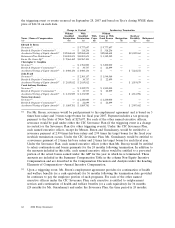
Former Officers
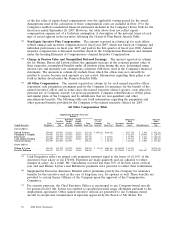
William B. Lytton ........ 11/21/06 11/21/06 $350,000 $ 700,000 $1,575,000
11/21/06 11/21/06 28,326 $1,363,492
11/21/06 11/21/06 94,420 $ 48.14 $1,489,343
06/29/07 07/12/06 1,790 $ 79,429
David E. Robinson ....... 11/21/06 11/21/06 $310,000 $ 620,000 $1,395,000
11/21/06 11/21/06 35,250 $1,696,783
11/21/06 11/21/06 110,157 $ 48.14 $1,737,572
06/29/07 07/12/06 4,532 $ 201,101
(1) The Compensation Committee approved the conversion of outstanding performance shares, originally granted in November 2005, into
time-based RSUs on July 12, 2006. These awards are reflected in column (j). The conversion was contingent upon the completion of
the Separation, which occurred on June 29, 2007. For more information on the performance share conversion, see the discussion under
the heading Conversion of 2006 Performance Shares in the Compensation Discussion and Analysis. In addition, in May 2007, the
Board approved the acceleration of the 2008 equity award grant that would have normally occurred in November 2007 to the first
trading day following the Separation. For more information about the acceleration of this grant, see the discussion under the heading
Accelerated Fiscal Year 2008 Equity Awards in the Compensation Discussion and Analysis.
(2) Amounts reported in columns (d) through (f) represent potential annual performance bonuses that the named executive officers could
have earned under the Company’s annual incentive plan for fiscal year 2007. In November 2006, the Board approved maximum bonus
payouts of 0.25% of net income before special items for Mr. Breen, subject to a cap of $5.0 million imposed by the 2004 SIP, and
0.12% for the other Senior Officers, subject to the same cap. At the same time, the Compensation Committee established a maximum
payout of 200% of base salary, plus or minus 25% based on individual qualitative performance measures for purposes of the annual
incentive plan. Amounts that were actually earned by such officers are reported in the Summary Compensation Table in the column
‘‘Non-Equity Incentive Plan Compensation.’’ As a result of the Separation, the performance measures that governed the payouts of
these awards were bifurcated between pre-Separation and post-Separation periods, although the threshold, target and maximum awards
that could be earned by the named executive officers remained the same. See the Compensation Discussion and Analysis under the
heading Annual Incentive Compensation for a description of performance measures and actual payouts under the annual incentive
plan.
(3) Amounts reported in columns (g) through (i) represent potential payouts with respect to performance share awards that were made in
connection with the accelerated fiscal year 2008 long-term incentive compensation grant. Performance shares were granted to certain
executive officers in July 2007 and vest at the end of the three-year performance period on June 30, 2010. The number of shares that
will be paid out in respect of the performance shares will depend on the Company’s three-year annualized total shareholder return
over the performance period, as compared to the return for the S&P 500 Industrials index. The fair value of performance shares was
calculated by multiplying the target number of shares granted by the grant date fair value as detemined under FAS 123R. For more
information regarding the Company’s 2008 performance share program, see the discussion under the heading Accelerated Fiscal Year
2008 Equity Awards.