ADT 2007 Annual Report Download - page 59
Download and view the complete annual report
Please find page 59 of the 2007 ADT annual report below. You can navigate through the pages in the report by either clicking on the pages listed below, or by using the keyword search tool below to find specific information within the annual report.-
 1
1 -
2
-
3
-
4
-
5
-
6
-
7
-
8
-
9
-
10
-
11
-
12
-
13
-
14
-
15
-
16
-
17
-
18
-
19
-
20
-
21
-
22
-
23
-
24
-
25
-
26
-
27
-
28
-
29
-
30
-
31
-
32
-
33
-
34
-
35
-
36
-
37
-
38
-
39
-
40
-
41
-
42
-
43
-
44
-
45
-
46
-
47
-
48
-
 49
49 -
 50
50 -
 51
51 -
 52
52 -
 53
53 -
 54
54 -
 55
55 -
 56
56 -
 57
57 -
 58
58 -
 59
59 -
 60
60 -
 61
61 -
 62
62 -
 63
63 -
 64
64 -
 65
65 -
 66
66 -
 67
67 -
 68
68 -
 69
69 -
70
-
71
-
72
-
73
-
74
-
75
-
76
-
77
-
78
-
79
-
80
-
81
-
82
-
83
-
84
-
85
-
86
-
87
-
88
-
89
-
90
-
91
-
92
-
93
-
94
-
95
-
96
-
97
-
98
-
99
-
100
-
101
-
102
-
103
-
104
-
105
-
106
-
107
-
108
-
109
-
110
-
111
-
112
-
113
-
114
-
115
-
116
-
117
-
118
-
119
-
120
-
121
-
122
-
123
-
124
-
125
-
126
-
127
-
128
-
129
-
130
-
131
-
132
-
133
-
134
-
135
-
136
-
137
-
138
-
139
-
140
-
141
-
142
-
143
-
144
-
145
-
146
-
147
-
148
-
149
-
150
-
151
-
152
-
153
-
154
-
155
-
156
-
157
-
158
-
159
-
160
-
161
-
162
-
163
-
164
-
165
-
166
-
167
-
168
-
169
-
170
-
171
-
172
-
173
-
174
-
175
-
176
-
177
-
178
-
179
-
180
-
181
-
182
-
183
-
184
-
185
-
186
-
187
-
188
-
189
-
190
-
191
-
192
-
193
-
194
-
195
-
196
-
197
-
198
-
199
-
200
-
201
-
202
-
203
-
204
-
205
-
206
-
207
-
208
-
209
-
210
-
211
-
212
-
213
-
214
-
215
-
216
-
217
-
218
-
219
-
220
-
221
-
222
-
223
-
224
-
225
-
226
-
227
-
228
-
229
-
230
-
231
-
232
-
233
-
234
-
235
-
236
-
237
-
238
-
239
-
240
-
241
-
242
-
243
-
244
-
245
-
246
-
247
-
248
-
249
-
250
-
251
-
252
-
253
-
254
-
255
-
256
-
257
-
258
-
259
-
260
-
261
-
262
-
263
-
264
-
265
-
266
-
267
-
268
-
269
-
270
-
271
-
272
-
273
-
274
 |
 |

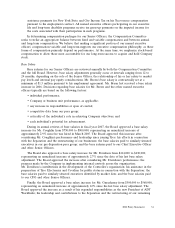
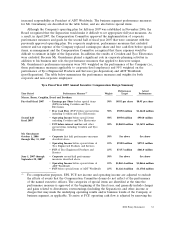
Committee developed target award value ranges for each of the Career Bands eligible for equity
awards.
Accelerated Fiscal Year 2008 Equity Awards
As described above, the Company moved the grant date for fiscal 2008 LTI compensation awards
from the first quarter of fiscal 2008 to July 2, 2007. Like the fiscal 2007 grant, the fiscal 2008 award
included stock options and RSUs. But unlike the 2007 grant, the accelerated 2008 award included
performance shares in the mix.
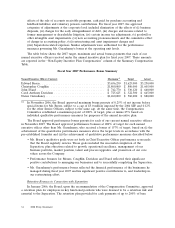
The Compensation Committee decided that one-third of the value of the target award for each
named executive officer would be delivered in stock options, one-third in RSUs and one-third in
performance shares. The Compensation Committee believed that by equally weighting each type of
equity award, it would effectively retain, motivate and incentivize employees on a post-Separation basis.
The Compensation Committee approved the accelerated equity award strategy in May 2007, contingent
on the completion of the Separation.
Target values for all employees who received accelerated 2008 grants, including our named
executive officers, ranged from one to two times the values of the fiscal 2007 awards. Mr. Breen’s
target award value was 1.2 times the value of his fiscal 2007 award, and the award value for our other
Senior Officers was, on average, 1.36 times that of their fiscal year 2007 award. In determining the
target award value for Mr. Breen, the Compensation Committee considered the target award ranges
recommended by its independent consultant; it also considered Mr. Breen’s performance in 2007, his
contributions to the Separation and his post-Separation equity holdings in Tyco. Target award values for
our other Senior Officers were based on similar considerations, plus the Chief Executive Officer’s
recommendations for awards to his direct reports.
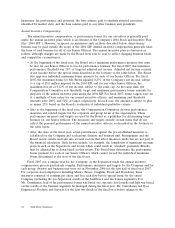
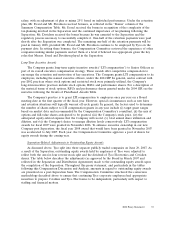
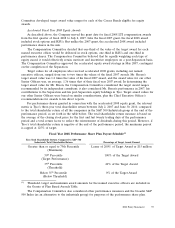
For performance shares granted in connection with the accelerated 2008 equity grant, the relevant
metric is Tyco’s three-year total shareholder return between July 2, 2007 and June 30, 2010, compared
to the total shareholder return of all the companies in the S&P 500 Industrials group at the end of the
performance period, as set forth in the table below. The total shareholder return measure is based on
the average of the closing stock price for the first and last twenty trading days of the performance
period and a total return factor to reflect the reinvestment of dividends during this period. However, if
Tyco’s total shareholder return is negative at the end of the performance period, the maximum payout
is capped at 125% of target.
Fiscal Year 2008 Performance Share Plan Payout Schedule(1)
Tyco Total Shareholder Return Compared to S&P 500
Industrials Total Shareholder Return Percentage of Target Award Earned
Greater than or equal to 75th Percentile Lesser of 200% of Target Award or $15 million
(Maximum)
50th Percentile 100% of the Target Award
(Target Performance)
35th Percentile 40% of the Target Award
(Threshold)
Below 35th Percentile 0% of the Target Award
(Below Threshold)
(1) Threshold, target and maximum award amounts for the named executive officers are included in
the Grants of Plan Based Awards Table.
The Compensation Committee also considered other performance measures and the broader S&P
500 Index (as an alternative to the industrials group) for purposes of the performance share plan.
2008 Proxy Statement 39