ADT 2007 Annual Report Download - page 248
Download and view the complete annual report
Please find page 248 of the 2007 ADT annual report below. You can navigate through the pages in the report by either clicking on the pages listed below, or by using the keyword search tool below to find specific information within the annual report.-
 1
1 -
2
-
3
-
4
-
5
-
6
-
7
-
8
-
9
-
10
-
11
-
12
-
13
-
14
-
15
-
16
-
17
-
18
-
19
-
20
-
21
-
22
-
23
-
24
-
25
-
26
-
27
-
28
-
29
-
30
-
31
-
32
-
33
-
34
-
35
-
36
-
37
-
38
-
39
-
40
-
41
-
42
-
43
-
44
-
45
-
46
-
47
-
48
-
49
-
50
-
51
-
52
-
53
-
54
-
55
-
56
-
57
-
58
-
59
-
60
-
61
-
62
-
63
-
64
-
65
-
66
-
67
-
68
-
69
-
70
-
71
-
72
-
73
-
74
-
75
-
76
-
77
-
78
-
79
-
80
-
81
-
82
-
83
-
84
-
85
-
86
-
87
-
88
-
89
-
90
-
91
-
92
-
93
-
94
-
95
-
96
-
97
-
98
-
99
-
100
-
101
-
102
-
103
-
104
-
105
-
106
-
107
-
108
-
109
-
110
-
111
-
112
-
113
-
114
-
115
-
116
-
117
-
118
-
119
-
120
-
121
-
122
-
123
-
124
-
125
-
126
-
127
-
128
-
129
-
130
-
131
-
132
-
133
-
134
-
135
-
136
-
137
-
138
-
139
-
140
-
141
-
142
-
143
-
144
-
145
-
146
-
147
-
148
-
149
-
150
-
151
-
152
-
153
-
154
-
155
-
156
-
157
-
158
-
159
-
160
-
161
-
162
-
163
-
164
-
165
-
166
-
167
-
168
-
169
-
170
-
171
-
172
-
173
-
174
-
175
-
176
-
177
-
178
-
179
-
180
-
181
-
182
-
183
-
184
-
185
-
186
-
187
-
188
-
189
-
190
-
191
-
192
-
193
-
194
-
195
-
196
-
197
-
198
-
199
-
200
-
201
-
202
-
203
-
204
-
205
-
206
-
207
-
208
-
209
-
210
-
211
-
212
-
213
-
214
-
215
-
216
-
217
-
218
-
219
-
220
-
221
-
222
-
223
-
224
-
225
-
226
-
227
-
228
-
229
-
230
-
231
-
232
-
233
-
234
-
235
-
236
-
237
-
 238
238 -
 239
239 -
 240
240 -
 241
241 -
 242
242 -
 243
243 -
 244
244 -
 245
245 -
 246
246 -
 247
247 -
 248
248 -
 249
249 -
 250
250 -
 251
251 -
 252
252 -
 253
253 -
 254
254 -
 255
255 -
 256
256 -
 257
257 -
 258
258 -
259
-
260
-
261
-
262
-
263
-
264
-
265
-
266
-
267
-
268
-
269
-
270
-
271
-
272
-
273
-
274
 |
 |

TYCO INTERNATIONAL LTD.
NOTES TO CONSOLIDATED FINANCIAL STATEMENTS
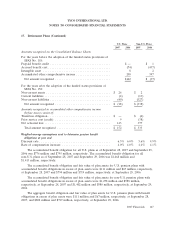
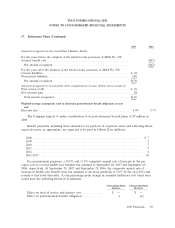
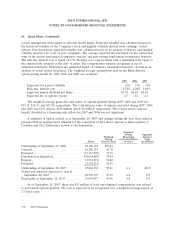
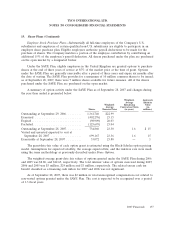
19. Share Plans (Continued)
certain assumptions with respect to selected model inputs. Expected volatility was calculated based on
the historical volatility of the Company’s stock and implied volatility derived from exchange traded
options. Post Separation, expected volatility was calculated based on an analysis of historic and implied
volatility measures for a set of peer companies. The average expected life was based on the contractual
term of the option and expected employee exercise and post-vesting employment termination behavior.
The risk-free interest rate is based on U.S. Treasury zero-coupon issues with a remaining term equal to
the expected life assumed at the date of grant. The compensation expense recognized is net of
estimated forfeitures. Forfeitures are estimated based on voluntary termination behavior, as well as an
analysis of actual option forfeitures. The weighted-average assumptions used in the Black-Scholes
option pricing model for 2007, 2006 and 2005 are as follows:
2007 2006 2005
Expected stock price volatility .............................. 30% 34% 35%
Risk free interest rate .................................... 4.52% 4.28% 3.88%
Expected annual dividend per share .......................... $0.58 $0.64 $0.64
Expected life of options (years) ............................. 4.7 4.2 4.1
The weighted-average grant-date fair values of options granted during 2007, 2006 and 2005 was
$15.35, $14.33, and $17.44, respectively. The total intrinsic value of options exercised during 2007, 2006
and 2005 was $163 million, $108 million and $142 million, respectively. The related excess cash tax
benefit classified as a financing cash inflow for 2007 and 2006 was not significant.
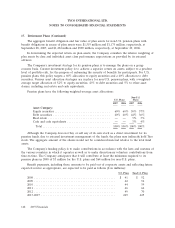
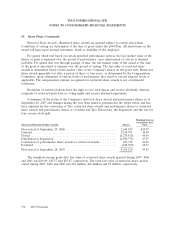
A summary of option activity as of September 28, 2007 and changes during the year then ended is
presented below and has been adjusted for the conversion of Tyco share options to share options of
Covidien and Tyco Electronics as well as the Separation:
Weighted-
Average Aggregate
Weighted- Remaining Intrinsic
Average Contractual Term Value
Shares Exercise Price (in years) (in millions)
Outstanding at September 29, 2006 ........ 64,109,138 $52.24
Granted ............................ 10,260,271 49.78
Exercised ........................... (11,141,505) 35.35
Distributed at Separation ............... (30,064,450) 57.04
Expired ............................ (3,954,891) 71.82
Forfeited ........................... (1,364,231) 50.43
Outstanding at September 28, 2007 ........ 27,844,332 50.21 6.1 $115
Vested and unvested expected to vest at
September 28, 2007 .................. 26,729,393 50.19 6.0 115
Exercisable at September 28, 2007 ......... 19,009,857 49.96 4.8 115
As of September 28, 2007, there was $93 million of total unrecognized compensation cost related
to non-vested options granted. The cost is expected to be recognized over a weighted-average period of
2.7 fiscal years.
156 2007 Financials