ADT 2007 Annual Report Download - page 258
Download and view the complete annual report
Please find page 258 of the 2007 ADT annual report below. You can navigate through the pages in the report by either clicking on the pages listed below, or by using the keyword search tool below to find specific information within the annual report.-
 1
1 -
2
-
3
-
4
-
5
-
6
-
7
-
8
-
9
-
10
-
11
-
12
-
13
-
14
-
15
-
16
-
17
-
18
-
19
-
20
-
21
-
22
-
23
-
24
-
25
-
26
-
27
-
28
-
29
-
30
-
31
-
32
-
33
-
34
-
35
-
36
-
37
-
38
-
39
-
40
-
41
-
42
-
43
-
44
-
45
-
46
-
47
-
48
-
49
-
50
-
51
-
52
-
53
-
54
-
55
-
56
-
57
-
58
-
59
-
60
-
61
-
62
-
63
-
64
-
65
-
66
-
67
-
68
-
69
-
70
-
71
-
72
-
73
-
74
-
75
-
76
-
77
-
78
-
79
-
80
-
81
-
82
-
83
-
84
-
85
-
86
-
87
-
88
-
89
-
90
-
91
-
92
-
93
-
94
-
95
-
96
-
97
-
98
-
99
-
100
-
101
-
102
-
103
-
104
-
105
-
106
-
107
-
108
-
109
-
110
-
111
-
112
-
113
-
114
-
115
-
116
-
117
-
118
-
119
-
120
-
121
-
122
-
123
-
124
-
125
-
126
-
127
-
128
-
129
-
130
-
131
-
132
-
133
-
134
-
135
-
136
-
137
-
138
-
139
-
140
-
141
-
142
-
143
-
144
-
145
-
146
-
147
-
148
-
149
-
150
-
151
-
152
-
153
-
154
-
155
-
156
-
157
-
158
-
159
-
160
-
161
-
162
-
163
-
164
-
165
-
166
-
167
-
168
-
169
-
170
-
171
-
172
-
173
-
174
-
175
-
176
-
177
-
178
-
179
-
180
-
181
-
182
-
183
-
184
-
185
-
186
-
187
-
188
-
189
-
190
-
191
-
192
-
193
-
194
-
195
-
196
-
197
-
198
-
199
-
200
-
201
-
202
-
203
-
204
-
205
-
206
-
207
-
208
-
209
-
210
-
211
-
212
-
213
-
214
-
215
-
216
-
217
-
218
-
219
-
220
-
221
-
222
-
223
-
224
-
225
-
226
-
227
-
228
-
229
-
230
-
231
-
232
-
233
-
234
-
235
-
236
-
237
-
238
-
239
-
240
-
241
-
242
-
243
-
244
-
245
-
246
-
247
-
 248
248 -
 249
249 -
 250
250 -
 251
251 -
 252
252 -
 253
253 -
 254
254 -
 255
255 -
 256
256 -
 257
257 -
 258
258 -
 259
259 -
 260
260 -
 261
261 -
 262
262 -
 263
263 -
 264
264 -
 265
265 -
 266
266 -
 267
267 -
 268
268 -
269
-
270
-
271
-
272
-
273
-
274
 |
 |

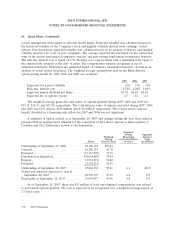
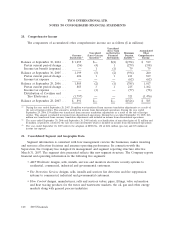
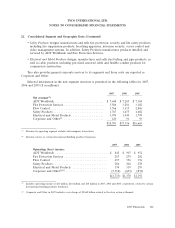
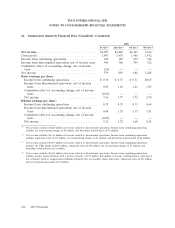
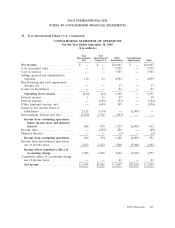
TYCO INTERNATIONAL LTD.
NOTES TO CONSOLIDATED FINANCIAL STATEMENTS
24. Summarized Quarterly Financial Data (Unaudited) (Continued)
2006
1st Qtr.(1) 2nd Qtr.(2) 3rd Qtr.(3) 4th Qtr.(4)
Net revenue .................................. $4,077 $4,222 $4,421 4,616
Gross profit .................................. 1,407 1,470 1,440 1,592
Income from continuing operations ................. 149 189 159 326
Income from discontinued operations, net of income taxes 444 706 709 922
Cumulative effect of accounting change, net of income
taxes ..................................... (14) — — —
Net income .................................. 579 895 868 1,248
Basic earnings per share:
Income from continuing operations ............... $ 0.30 $ 0.37 $ 0.31 $0.65
Income from discontinued operations, net of income
taxes ................................... 0.89 1.40 1.41 1.85
Cumulative effect of accounting change, net of income
taxes ................................... (0.03) — — —
Net income ................................ 1.16 1.77 1.72 2.50
Diluted earnings per share:
Income from continuing operations ............... 0.29 0.37 0.31 0.64
Income from discontinued operations, net of income
taxes ................................... 0.86 1.35 1.37 1.81
Cumulative effect of accounting change, net of income
taxes ................................... (0.03) — — —
Net income ................................ 1.12 1.72 1.68 2.45
(1) Net revenue excludes $6,203 million of revenue related to discontinued operations. Income from continuing operations
includes net restructuring charges of $4 million, and divestiture-related losses of $3 million.
(2) Net revenue excludes $6,341 million of revenue related to discontinued operations. Income from continuing operations
includes separation costs of $13 million, net restructuring charges of $3 million, and divestiture-related gains of $2 million.
(3) Net revenue excludes $6,007 million of revenue related to discontinued operations. Income from continuing operations
includes the VRP charge of $100 million, separation costs of $19 million, net restructuring charges of $7 million, and
divestiture-related losses of $1 million.
(4) Net revenue excludes $6,246 million of revenue related to discontinued operations. Income from continuing operations
includes income from settlement with a former executive of $72 million, $48 million of income resulting from a reduction in
our estimated workers’ compensation liabilities primarily due to favorable claims experience, separation costs of $17 million,
and net restructuring credits of $1 million.
166 2007 Financials