ADT 2007 Annual Report Download - page 257
Download and view the complete annual report
Please find page 257 of the 2007 ADT annual report below. You can navigate through the pages in the report by either clicking on the pages listed below, or by using the keyword search tool below to find specific information within the annual report.-
 1
1 -
2
-
3
-
4
-
5
-
6
-
7
-
8
-
9
-
10
-
11
-
12
-
13
-
14
-
15
-
16
-
17
-
18
-
19
-
20
-
21
-
22
-
23
-
24
-
25
-
26
-
27
-
28
-
29
-
30
-
31
-
32
-
33
-
34
-
35
-
36
-
37
-
38
-
39
-
40
-
41
-
42
-
43
-
44
-
45
-
46
-
47
-
48
-
49
-
50
-
51
-
52
-
53
-
54
-
55
-
56
-
57
-
58
-
59
-
60
-
61
-
62
-
63
-
64
-
65
-
66
-
67
-
68
-
69
-
70
-
71
-
72
-
73
-
74
-
75
-
76
-
77
-
78
-
79
-
80
-
81
-
82
-
83
-
84
-
85
-
86
-
87
-
88
-
89
-
90
-
91
-
92
-
93
-
94
-
95
-
96
-
97
-
98
-
99
-
100
-
101
-
102
-
103
-
104
-
105
-
106
-
107
-
108
-
109
-
110
-
111
-
112
-
113
-
114
-
115
-
116
-
117
-
118
-
119
-
120
-
121
-
122
-
123
-
124
-
125
-
126
-
127
-
128
-
129
-
130
-
131
-
132
-
133
-
134
-
135
-
136
-
137
-
138
-
139
-
140
-
141
-
142
-
143
-
144
-
145
-
146
-
147
-
148
-
149
-
150
-
151
-
152
-
153
-
154
-
155
-
156
-
157
-
158
-
159
-
160
-
161
-
162
-
163
-
164
-
165
-
166
-
167
-
168
-
169
-
170
-
171
-
172
-
173
-
174
-
175
-
176
-
177
-
178
-
179
-
180
-
181
-
182
-
183
-
184
-
185
-
186
-
187
-
188
-
189
-
190
-
191
-
192
-
193
-
194
-
195
-
196
-
197
-
198
-
199
-
200
-
201
-
202
-
203
-
204
-
205
-
206
-
207
-
208
-
209
-
210
-
211
-
212
-
213
-
214
-
215
-
216
-
217
-
218
-
219
-
220
-
221
-
222
-
223
-
224
-
225
-
226
-
227
-
228
-
229
-
230
-
231
-
232
-
233
-
234
-
235
-
236
-
237
-
238
-
239
-
240
-
241
-
242
-
243
-
244
-
245
-
246
-
 247
247 -
 248
248 -
 249
249 -
 250
250 -
 251
251 -
 252
252 -
 253
253 -
 254
254 -
 255
255 -
 256
256 -
 257
257 -
 258
258 -
 259
259 -
 260
260 -
 261
261 -
 262
262 -
 263
263 -
 264
264 -
 265
265 -
 266
266 -
 267
267 -
268
-
269
-
270
-
271
-
272
-
273
-
274
 |
 |

TYCO INTERNATIONAL LTD.
NOTES TO CONSOLIDATED FINANCIAL STATEMENTS
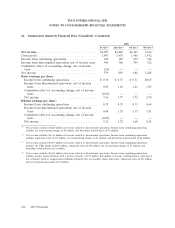
24. Summarized Quarterly Financial Data (Unaudited)
Summarized quarterly financial data for the years ended September 28, 2007 and September 29,
2006 is as follows ($ in millions, except per share data):
2007
1st Qtr.(1) 2nd Qtr.(2) 3rd Qtr.(3) 4th Qtr.(4)
Net revenue .................................. $4,408 $4,570 $4,775 $5,028
Gross profit .................................. 1,502 1,523 1,616 1,699
Income (loss) from continuing operations ............ 164 156 (3,049) 210
Income (loss) from discontinued operations, net of
income taxes ............................... 629 679 (502) (29)
Net income (loss) ............................. 793 835 (3,551) 181
Basic earnings per share:
Income (loss) from continuing operations .......... $ 0.33 $ 0.32 $ (6.16) $ 0.42
Income (loss) from discontinued operations, net of
income taxes .............................. 1.27 1.37 (1.02) (0.06)
Net income (loss) ............................ 1.60 1.69 (7.18) 0.36
Diluted earnings per share:
Income (loss) from continuing operations .......... 0.33 0.31 (6.16) 0.42
Income (loss) from discontinued operations, net of
income taxes .............................. 1.24 1.35 (1.02) (0.06)
Net income (loss) ............................ 1.57 1.66 (7.18) 0.36
(1) Net revenue excludes $5,951 million of revenue related to discontinued operations. Income from continuing operations
includes net restructuring charges of $57 million, and separation costs of $25 million.
(2) Net revenue excludes $6,268 million of revenue related to discontinued operations. Income from continuing operations
includes net restructuring and asset impairment charges of $53 million, separation costs of $32 million, and divestiture-
related losses of $3 million.
(3) Net revenue excludes $6,391 million of revenue related to discontinued operations. Income from continuing operations
includes a class action settlement charge, net of $2.875 billion, a $259 million charge related to loss on early extinguishment
of debt, a goodwill impairment charge of $46 million, net restructuring and asset impairment charges of $47 million,
separation costs of $28 million, and divestiture-related losses of $1 million.
(4) Net revenue excludes $356 million of revenue related to discontinued operations. Income from continuing operations
includes net restructuring and asset impairment charges of $60 million, separation costs of $20 million, a $13 million
insurance recovery related to the class action settlement, and $10 million of charges related to a Voluntary Replacement
Program. Income tax provision includes the negative impact of approximately $58 million related to changes in valuation
allowances, reserve adjustments and nondeductible costs, partially offset by favorable adjustments of approximately
$48 million related to prior periods.
2007 Financials 165