ADT 2007 Annual Report Download - page 152
Download and view the complete annual report
Please find page 152 of the 2007 ADT annual report below. You can navigate through the pages in the report by either clicking on the pages listed below, or by using the keyword search tool below to find specific information within the annual report.-
 1
1 -
2
-
3
-
4
-
5
-
6
-
7
-
8
-
9
-
10
-
11
-
12
-
13
-
14
-
15
-
16
-
17
-
18
-
19
-
20
-
21
-
22
-
23
-
24
-
25
-
26
-
27
-
28
-
29
-
30
-
31
-
32
-
33
-
34
-
35
-
36
-
37
-
38
-
39
-
40
-
41
-
42
-
43
-
44
-
45
-
46
-
47
-
48
-
49
-
50
-
51
-
52
-
53
-
54
-
55
-
56
-
57
-
58
-
59
-
60
-
61
-
62
-
63
-
64
-
65
-
66
-
67
-
68
-
69
-
70
-
71
-
72
-
73
-
74
-
75
-
76
-
77
-
78
-
79
-
80
-
81
-
82
-
83
-
84
-
85
-
86
-
87
-
88
-
89
-
90
-
91
-
92
-
93
-
94
-
95
-
96
-
97
-
98
-
99
-
100
-
101
-
102
-
103
-
104
-
105
-
106
-
107
-
108
-
109
-
110
-
111
-
112
-
113
-
114
-
115
-
116
-
117
-
118
-
119
-
120
-
121
-
122
-
123
-
124
-
125
-
126
-
127
-
128
-
129
-
130
-
131
-
132
-
133
-
134
-
135
-
136
-
137
-
138
-
139
-
140
-
141
-
 142
142 -
 143
143 -
 144
144 -
 145
145 -
 146
146 -
 147
147 -
 148
148 -
 149
149 -
 150
150 -
 151
151 -
 152
152 -
 153
153 -
 154
154 -
 155
155 -
 156
156 -
 157
157 -
 158
158 -
 159
159 -
 160
160 -
 161
161 -
 162
162 -
163
-
164
-
165
-
166
-
167
-
168
-
169
-
170
-
171
-
172
-
173
-
174
-
175
-
176
-
177
-
178
-
179
-
180
-
181
-
182
-
183
-
184
-
185
-
186
-
187
-
188
-
189
-
190
-
191
-
192
-
193
-
194
-
195
-
196
-
197
-
198
-
199
-
200
-
201
-
202
-
203
-
204
-
205
-
206
-
207
-
208
-
209
-
210
-
211
-
212
-
213
-
214
-
215
-
216
-
217
-
218
-
219
-
220
-
221
-
222
-
223
-
224
-
225
-
226
-
227
-
228
-
229
-
230
-
231
-
232
-
233
-
234
-
235
-
236
-
237
-
238
-
239
-
240
-
241
-
242
-
243
-
244
-
245
-
246
-
247
-
248
-
249
-
250
-
251
-
252
-
253
-
254
-
255
-
256
-
257
-
258
-
259
-
260
-
261
-
262
-
263
-
264
-
265
-
266
-
267
-
268
-
269
-
270
-
271
-
272
-
273
-
274
 |
 |
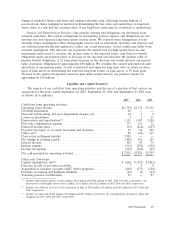
In each period, net interest amounts were proportionally allocated to Covidien and Tyco
Electronics based on the debt amounts that we believe were utilized by Covidien and Tyco Electronics
historically inclusive of amounts directly incurred and is reflected as discontinued operations. Allocated
net interest was calculated using our historical weighted average interest rate on debt, including the
impact of interest rate swap agreements. The portion of Tyco’s interest income allocated to Covidien
and Tyco Electronics was $35 million, $53 million and $43 million during 2007, 2006 and 2005,
respectively. The portion of Tyco’s interest expense allocated to Covidien and Tyco Electronics was
$242 million, $378 million and $433 million during 2007, 2006 and 2005, respectively.
Other Expense, Net
Other expense, net was $255 million in 2007 and $296 million in 2005. During 2007, other expense,
net consisted primarily of a $259 million loss on early extinguishment of debt incurred in connection
with the debt tender offers (see Note 13), for which no tax benefit is available. This charge consists
primarily of premiums paid and the write-off of unamortized debt issuance costs and discounts. The
total loss on early extinguishment of debt was $647 million, with $259 million included in continuing
operations and $388 million allocated to Covidien and Tyco Electronics and included in discontinued
operations.
During 2005, other expense, net consisted primarily of losses related to the repurchase of
outstanding convertible debt prior to its scheduled maturity partially offset by a $109 million court-
ordered restitution award.
During 2005, the Company repurchased $1,241 million principal amount of its outstanding 2.75%
convertible senior debentures for $1,823 million and $750 million principal amount of its outstanding
3.125% convertible senior debentures for $1,147 million. These repurchases resulted in a $1,013 million
loss on the retirement of debt, including the write-off of unamortized debt issuance costs, with $405
included in continuing operations and $608 million allocated to Covidien and Tyco Electronics and
included in discontinued operations.
Additionally, in September 2005, we were awarded a total of $134 million as restitution in
connection with our litigation against Mr. L. Dennis Kozlowski, our former Chairman and Chief
Executive Officer, and Mr. Mark H. Swartz, our former Chief Financial Officer and Director (together,
the ‘‘Defendants’’), as described in Item 3. Legal Proceedings. The restitution award is comprised of
$109 million of previously expensed compensation made to the Defendants and reported as other
expense, net in prior years and $25 million related to a loan receivable from Mr. L. Dennis Kozlowski
which had been reflected in the Company’s Consolidated Financial Statements as a receivable. During
2007, the Company received payment for these amounts.
Income Taxes
Effective Income Tax Rate
The effective tax rate for 2007 is not meaningful primarily as a result of the class action settlement
charge, net of $2.862 billion and the loss on early extinguishment of debt of $259 million for which no
tax benefit is available. Additionally, taxes for 2007 were negatively impacted by tax costs related to the
Separation. Our effective income tax rate was 27.3% and 4.7% for 2006 and 2005, respectively. The
increase in the effective tax rate from 2005 to 2006 was primarily the result of a lower release of
deferred tax asset valuation allowances, increased profits in higher tax rate jurisdictions and
adjustments to the tax accrual for legacy tax matters in 2005, partially offset by the loss on retirement
of debt for which no benefit was available in 2005.
The valuation allowance for deferred tax assets of $666 million and $800 million at September 28,
2007 and September 29, 2006, respectively, relates principally to the uncertainty of the utilization of
certain deferred tax assets, primarily tax loss and credit carryforwards in various jurisdictions. We
60 2007 Financials