ADT 2007 Annual Report Download - page 146
Download and view the complete annual report
Please find page 146 of the 2007 ADT annual report below. You can navigate through the pages in the report by either clicking on the pages listed below, or by using the keyword search tool below to find specific information within the annual report.-
 1
1 -
2
-
3
-
4
-
5
-
6
-
7
-
8
-
9
-
10
-
11
-
12
-
13
-
14
-
15
-
16
-
17
-
18
-
19
-
20
-
21
-
22
-
23
-
24
-
25
-
26
-
27
-
28
-
29
-
30
-
31
-
32
-
33
-
34
-
35
-
36
-
37
-
38
-
39
-
40
-
41
-
42
-
43
-
44
-
45
-
46
-
47
-
48
-
49
-
50
-
51
-
52
-
53
-
54
-
55
-
56
-
57
-
58
-
59
-
60
-
61
-
62
-
63
-
64
-
65
-
66
-
67
-
68
-
69
-
70
-
71
-
72
-
73
-
74
-
75
-
76
-
77
-
78
-
79
-
80
-
81
-
82
-
83
-
84
-
85
-
86
-
87
-
88
-
89
-
90
-
91
-
92
-
93
-
94
-
95
-
96
-
97
-
98
-
99
-
100
-
101
-
102
-
103
-
104
-
105
-
106
-
107
-
108
-
109
-
110
-
111
-
112
-
113
-
114
-
115
-
116
-
117
-
118
-
119
-
120
-
121
-
122
-
123
-
124
-
125
-
126
-
127
-
128
-
129
-
130
-
131
-
132
-
133
-
134
-
135
-
 136
136 -
 137
137 -
 138
138 -
 139
139 -
 140
140 -
 141
141 -
 142
142 -
 143
143 -
 144
144 -
 145
145 -
 146
146 -
 147
147 -
 148
148 -
 149
149 -
 150
150 -
 151
151 -
 152
152 -
 153
153 -
 154
154 -
 155
155 -
 156
156 -
157
-
158
-
159
-
160
-
161
-
162
-
163
-
164
-
165
-
166
-
167
-
168
-
169
-
170
-
171
-
172
-
173
-
174
-
175
-
176
-
177
-
178
-
179
-
180
-
181
-
182
-
183
-
184
-
185
-
186
-
187
-
188
-
189
-
190
-
191
-
192
-
193
-
194
-
195
-
196
-
197
-
198
-
199
-
200
-
201
-
202
-
203
-
204
-
205
-
206
-
207
-
208
-
209
-
210
-
211
-
212
-
213
-
214
-
215
-
216
-
217
-
218
-
219
-
220
-
221
-
222
-
223
-
224
-
225
-
226
-
227
-
228
-
229
-
230
-
231
-
232
-
233
-
234
-
235
-
236
-
237
-
238
-
239
-
240
-
241
-
242
-
243
-
244
-
245
-
246
-
247
-
248
-
249
-
250
-
251
-
252
-
253
-
254
-
255
-
256
-
257
-
258
-
259
-
260
-
261
-
262
-
263
-
264
-
265
-
266
-
267
-
268
-
269
-
270
-
271
-
272
-
273
-
274
 |
 |

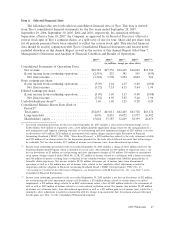
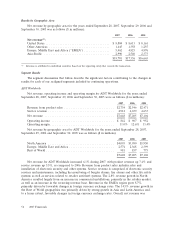
Results by Geographic Area
Net revenue by geographic area for the years ended September 28, 2007, September 29, 2006 and
September 30, 2005 was as follows ($ in millions):
2007 2006 2005
Net revenue(1):
United States ..................................... $ 8,884 $ 8,613 $ 8,161
Other Americas ................................... 1,445 1,358 1,255
Europe, Middle East and Africa (‘‘EMEA’’) ............... 5,462 4,825 4,876
Asia-Pacific ...................................... 2,990 2,540 2,373
$18,781 $17,336 $16,665
(1) Revenue is attributed to individual countries based on the reporting entity that records the transaction.
Segment Results
The segment discussions that follow describe the significant factors contributing to the changes in
results for each of our realigned segments included in continuing operations.
ADT Worldwide
Net revenue, operating income and operating margin for ADT Worldwide for the years ended
September 28, 2007, September 29, 2006 and September 30, 2005 were as follows ($ in millions):
2007 2006 2005
Revenue from product sales ............................. $2,734 $2,546 $2,471
Service revenue ...................................... 4,914 4,659 4,633
Net revenue ........................................ $7,648 $7,205 $7,104
Operating income .................................... $ 842 $ 907 $ 952
Operating margin ..................................... 11.0% 12.6% 13.4%
Net revenue by geographic area for ADT Worldwide for the years ended September 28, 2007,
September 29, 2006 and September 30, 2005 was as follows ($ in millions):
2007 2006 2005
North America ...................................... $4,093 $3,980 $3,930
Europe, Middle East and Africa .......................... 2,574 2,368 2,399
Rest of World ....................................... 981 857 775
$7,648 $7,205 $7,104
Net revenue for ADT Worldwide increased 6.1% during 2007, with product revenue up 7.4% and
service revenue up 5.5%, as compared to 2006. Revenue from product sales includes sales and
installation of electronic security and other systems. Service revenue is comprised of electronic security
services and maintenance, including the monitoring of burglar alarms, fire alarms and other life safety
systems as well as services related to retailer anti-theft systems. The 2.8% revenue growth in North
America resulted largely from an increase in commercial installations, primarily in the retailer market,
as well as an increase in the recurring revenue base. Revenue in the EMEA region grew 8.7%,
primarily driven by favorable changes in foreign currency exchange rates. The 14.5% revenue growth in
the Rest of World geographies was primarily driven by strong growth in Asia and Latin America and,
to a lesser extent, favorable changes in foreign currency exchange rates. Overall, net revenue was
54 2007 Financials