ADT 2007 Annual Report Download - page 139
Download and view the complete annual report
Please find page 139 of the 2007 ADT annual report below. You can navigate through the pages in the report by either clicking on the pages listed below, or by using the keyword search tool below to find specific information within the annual report.-
 1
1 -
2
-
3
-
4
-
5
-
6
-
7
-
8
-
9
-
10
-
11
-
12
-
13
-
14
-
15
-
16
-
17
-
18
-
19
-
20
-
21
-
22
-
23
-
24
-
25
-
26
-
27
-
28
-
29
-
30
-
31
-
32
-
33
-
34
-
35
-
36
-
37
-
38
-
39
-
40
-
41
-
42
-
43
-
44
-
45
-
46
-
47
-
48
-
49
-
50
-
51
-
52
-
53
-
54
-
55
-
56
-
57
-
58
-
59
-
60
-
61
-
62
-
63
-
64
-
65
-
66
-
67
-
68
-
69
-
70
-
71
-
72
-
73
-
74
-
75
-
76
-
77
-
78
-
79
-
80
-
81
-
82
-
83
-
84
-
85
-
86
-
87
-
88
-
89
-
90
-
91
-
92
-
93
-
94
-
95
-
96
-
97
-
98
-
99
-
100
-
101
-
102
-
103
-
104
-
105
-
106
-
107
-
108
-
109
-
110
-
111
-
112
-
113
-
114
-
115
-
116
-
117
-
118
-
119
-
120
-
121
-
122
-
123
-
124
-
125
-
126
-
127
-
128
-
 129
129 -
 130
130 -
 131
131 -
 132
132 -
 133
133 -
 134
134 -
 135
135 -
 136
136 -
 137
137 -
 138
138 -
 139
139 -
 140
140 -
 141
141 -
 142
142 -
 143
143 -
 144
144 -
 145
145 -
 146
146 -
 147
147 -
 148
148 -
 149
149 -
150
-
151
-
152
-
153
-
154
-
155
-
156
-
157
-
158
-
159
-
160
-
161
-
162
-
163
-
164
-
165
-
166
-
167
-
168
-
169
-
170
-
171
-
172
-
173
-
174
-
175
-
176
-
177
-
178
-
179
-
180
-
181
-
182
-
183
-
184
-
185
-
186
-
187
-
188
-
189
-
190
-
191
-
192
-
193
-
194
-
195
-
196
-
197
-
198
-
199
-
200
-
201
-
202
-
203
-
204
-
205
-
206
-
207
-
208
-
209
-
210
-
211
-
212
-
213
-
214
-
215
-
216
-
217
-
218
-
219
-
220
-
221
-
222
-
223
-
224
-
225
-
226
-
227
-
228
-
229
-
230
-
231
-
232
-
233
-
234
-
235
-
236
-
237
-
238
-
239
-
240
-
241
-
242
-
243
-
244
-
245
-
246
-
247
-
248
-
249
-
250
-
251
-
252
-
253
-
254
-
255
-
256
-
257
-
258
-
259
-
260
-
261
-
262
-
263
-
264
-
265
-
266
-
267
-
268
-
269
-
270
-
271
-
272
-
273
-
274
 |
 |

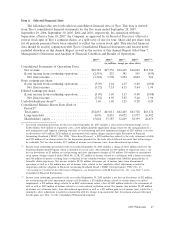
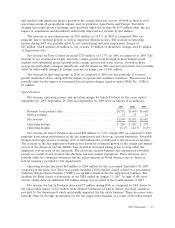
Item 6. Selected Financial Data
The following table sets forth selected consolidated financial data of Tyco. This data is derived
from Tyco’s consolidated financial statements for the five years ended September 28, 2007,
September 29, 2006, September 30, 2005, 2004 and 2003, respectively. In connection with the
Separation, effective June 29, 2007, the Company, as approved by its Board of Directors, effected a
reverse stock split of Tyco’s common shares, at a split ratio of one for four. Share and per share data
for all periods presented have been adjusted to reflect the reverse stock split. This selected financial
data should be read in conjunction with Tyco’s Consolidated Financial Statements and related notes
included elsewhere in this Annual Report as well as the section of this Annual Report titled Item 7.
Management’s Discussion and Analysis of Financial Condition and Results of Operations.
2007(1) 2006(2) 2005(3) 2004(4) 2003(5)(6)
(in millions, except per share data)
Consolidated Statements of Operations Data:
Net revenue ........................... $18,781 $17,336 $16,665 $16,029 $14,726
(Loss) income from continuing operations ...... (2,519) 823 581 345 (439)
Net (loss) income ...................... (1,742) 3,590 3,094 2,822 966
Basic earnings per share:
(Loss) income from continuing operations ...... (5.09) 1.64 1.15 0.69 (0.88)
Net (loss) income ...................... (3.52) 7.14 6.15 5.64 1.94
Diluted earnings per share:
(Loss) income from continuing operations ...... (5.09) 1.60 1.13 0.68 (0.88)
Net (loss) income ...................... (3.52) 6.95 5.85 5.60 1.94
Cash dividends per share(7) .................. 1.60 1.60 1.25 0.20 0.20
Consolidated Balance Sheets Data (End of
Period)(8):
Total assets ............................ $32,815 $63,011 $62,465 $63,718 $63,174
Long-term debt ......................... 4,076 8,853 10,072 13,917 16,992
Shareholders’ equity ...................... 15,624 35,387 32,619 30,399 26,451
(1) Loss from continuing operations for the year ended September 28, 2007 includes a class action settlement charge, net of
$2.862 billion, $105 million of separation costs, a $46 million goodwill impairment charge related to the reorganization to a
new management and segment reporting structure, net restructuring and asset impairment charges of $217 million, a net loss
on divestitures of $4 million, $120 million of incremental stock option charges required under Statement of Financial
Accounting Standards (‘‘SFAS’’) No. 123R, ‘‘Share-Based Payment,’’ a $259 million loss related to the early retirement of debt
and $95 million of tax charges related to the Separation primarily for the write-off of deferred tax assets that will no longer
be realizable. Net loss also includes $777 million of income, net of income taxes, from discontinued operations.
(2) Income from continuing operations for the year ended September 29, 2006 includes a charge of $100 million related to the
Voluntary Replacement Program, which is included in cost of sales. Also included are $49 million of separation costs, a net
loss on divestitures of $2 million, net restructuring and asset impairment charges of $13 million, $84 million of incremental
stock option charges required under SFAS No. 123R, $72 million of income related to a settlement with a former executive
and $48 million of income resulting from a reduction in our estimated workers’ compensation liabilities primarily due to
favorable claims experience. Net income includes $2,781 million of income, net of income taxes, from discontinued
operations as well as a $14 million loss, net of income taxes, related to the cumulative effect adjustment recorded in
conjunction with the adoption of Financial Accounting Standards Board (‘‘FASB’’) Interpretation (‘‘FIN’’) No. 47,
‘‘Accounting for Conditional Asset Retirement Obligations—an Interpretation of FASB Statement No. 143’’ (see Note 7 to the
Consolidated Financial Statements).
(3) Income from continuing operations for the year ended September 30, 2005 includes a net loss on divestitures of $23 million,
net restructuring and asset impairment charges of $18 million, a $70 million charge related to certain former executives’
employment, a $50 million charge related to an SEC enforcement action, a loss of $405 million related to the retirement of
debt as well as $109 million of income related to a court-ordered restitution award. Net income also includes $2,492 million
of income, net of income taxes, from discontinued operations as well as a $21 million gain, net of income taxes, related to a
cumulative effect adjustment recorded in conjunction with the change in measurement date for pension and postretirement
benefit plans (see Note 7 to the Consolidated Financial Statements).
2007 Financials 47