ADT 2007 Annual Report Download - page 162
Download and view the complete annual report
Please find page 162 of the 2007 ADT annual report below. You can navigate through the pages in the report by either clicking on the pages listed below, or by using the keyword search tool below to find specific information within the annual report.-
 1
1 -
2
-
3
-
4
-
5
-
6
-
7
-
8
-
9
-
10
-
11
-
12
-
13
-
14
-
15
-
16
-
17
-
18
-
19
-
20
-
21
-
22
-
23
-
24
-
25
-
26
-
27
-
28
-
29
-
30
-
31
-
32
-
33
-
34
-
35
-
36
-
37
-
38
-
39
-
40
-
41
-
42
-
43
-
44
-
45
-
46
-
47
-
48
-
49
-
50
-
51
-
52
-
53
-
54
-
55
-
56
-
57
-
58
-
59
-
60
-
61
-
62
-
63
-
64
-
65
-
66
-
67
-
68
-
69
-
70
-
71
-
72
-
73
-
74
-
75
-
76
-
77
-
78
-
79
-
80
-
81
-
82
-
83
-
84
-
85
-
86
-
87
-
88
-
89
-
90
-
91
-
92
-
93
-
94
-
95
-
96
-
97
-
98
-
99
-
100
-
101
-
102
-
103
-
104
-
105
-
106
-
107
-
108
-
109
-
110
-
111
-
112
-
113
-
114
-
115
-
116
-
117
-
118
-
119
-
120
-
121
-
122
-
123
-
124
-
125
-
126
-
127
-
128
-
129
-
130
-
131
-
132
-
133
-
134
-
135
-
136
-
137
-
138
-
139
-
140
-
141
-
142
-
143
-
144
-
145
-
146
-
147
-
148
-
149
-
150
-
151
-
 152
152 -
 153
153 -
 154
154 -
 155
155 -
 156
156 -
 157
157 -
 158
158 -
 159
159 -
 160
160 -
 161
161 -
 162
162 -
 163
163 -
 164
164 -
 165
165 -
 166
166 -
 167
167 -
 168
168 -
 169
169 -
 170
170 -
 171
171 -
 172
172 -
173
-
174
-
175
-
176
-
177
-
178
-
179
-
180
-
181
-
182
-
183
-
184
-
185
-
186
-
187
-
188
-
189
-
190
-
191
-
192
-
193
-
194
-
195
-
196
-
197
-
198
-
199
-
200
-
201
-
202
-
203
-
204
-
205
-
206
-
207
-
208
-
209
-
210
-
211
-
212
-
213
-
214
-
215
-
216
-
217
-
218
-
219
-
220
-
221
-
222
-
223
-
224
-
225
-
226
-
227
-
228
-
229
-
230
-
231
-
232
-
233
-
234
-
235
-
236
-
237
-
238
-
239
-
240
-
241
-
242
-
243
-
244
-
245
-
246
-
247
-
248
-
249
-
250
-
251
-
252
-
253
-
254
-
255
-
256
-
257
-
258
-
259
-
260
-
261
-
262
-
263
-
264
-
265
-
266
-
267
-
268
-
269
-
270
-
271
-
272
-
273
-
274
 |
 |
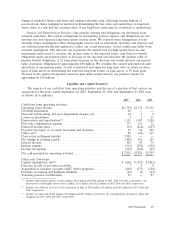
The net change in total working capital was a cash decrease of $405 million in 2007. The
components of this change are set forth in the Consolidated Statements of Cash Flows. The significant
changes in working capital included a $166 million increase in inventories, a $128 million increase in
accounts receivable, and $244 million of changes in income taxes, net, which includes a payment of
legacy tax liabilities. Additionally, working capital includes the collection of $38 million related to
restitution owed by Mark H. Swartz, former Chief Financial Officer and Director, and $98 million
related to the restitution owed by L. Dennis Kozlowski, former Chairman and Chief Executive Officer.
During the third quarter of 2007, Tyco entered into the class action settlement and borrowed
under its unsecured bridge loan and revolving credit facilities to fund the $2.992 billion liability, placing
the proceeds in escrow for the benefit of the class.
During 2007, we completed the sale of the AIJ business for $42 million in net cash proceeds.
Additionally, during 2007, we received $271 million due to the liquidation of investments in a rabbi
trust, as well as $136 million in restitution payments owed by former executives as described above.
We continue to fund capital expenditures to improve the cost structure of our businesses, to invest
in new processes and technology, and to maintain high quality production standards. Capital spending
increased to $669 million in 2007 from $558 million in 2006. The level of capital expenditures in 2008 is
expected to exceed spending levels in 2007 and is also expected to exceed depreciation.
In September 2007, Tyco’s Board of Directors approved a new $1.0 billion share repurchase
program under which, we repurchased 1.3 million common shares for $56 million. During the first
quarter of 2007 we repurchased 5 million common shares for $659 million completing the $2.0 billion
share repurchase program approved by the Board of Directors in May 2006. This followed the
repurchase of 13 million common shares for $1.3 billion in 2006. Additionally during 2006, we
completed the $1.5 billion share repurchase program approved by the Board of Directors in July of
2005 with the repurchase of 11 million common shares for $1.2 billion.
In 2006, we commenced the termination of our interest rate and cross currency swaps, which were
designated as fair value hedges. During 2007, we terminated the remaining swaps. Such terminations
resulted in a net cash inflow of $63 million.
During the first quarter of 2007, we launched a $350 million to $400 million company-wide
restructuring program. During 2007, 2006 and 2005 we paid out $70 million, $32 million and
$103 million, respectively, in cash related to restructuring activities. See Note 3 to our Consolidated
Financial Statements for further information regarding our restructuring activities.
Income taxes paid, net of refunds, related to continuing operations was $650 million in 2007, which
included $295 million of legacy tax liability payments of amounts not yet due to the IRS in respect of
their examination of our 1997 through 2000 U.S. federal income tax returns (the ultimate resolution of
which is uncertain).
During 2007, 2006 and 2005, Tyco paid $409 million, $373 million and $328 million of cash,
respectively, to acquire approximately 415,000, 401,000 and 364,000 customer contracts for electronic
security services through the ADT dealer program.
During 2007, 2006 and 2005, we paid $10 million, $7 million and $14 million, respectively, in cash
for purchase accounting and holdback liabilities. Holdback liabilities represent a portion of the
purchase price withheld from the seller pending finalization of the acquisition balance sheet and other
contingencies. At September 28, 2007 holdback liabilities on our Consolidated Balance Sheets were
$16 million, which are included in other liabilities. At September 28, 2007, $14 million of acquisition
liabilities remained on our Consolidated Balance Sheets, of which $4 million are included in accrued
and other current liabilities and $10 million are included in other liabilities.
70 2007 Financials