ADT 2007 Annual Report Download - page 211
Download and view the complete annual report
Please find page 211 of the 2007 ADT annual report below. You can navigate through the pages in the report by either clicking on the pages listed below, or by using the keyword search tool below to find specific information within the annual report.-
 1
1 -
2
-
3
-
4
-
5
-
6
-
7
-
8
-
9
-
10
-
11
-
12
-
13
-
14
-
15
-
16
-
17
-
18
-
19
-
20
-
21
-
22
-
23
-
24
-
25
-
26
-
27
-
28
-
29
-
30
-
31
-
32
-
33
-
34
-
35
-
36
-
37
-
38
-
39
-
40
-
41
-
42
-
43
-
44
-
45
-
46
-
47
-
48
-
49
-
50
-
51
-
52
-
53
-
54
-
55
-
56
-
57
-
58
-
59
-
60
-
61
-
62
-
63
-
64
-
65
-
66
-
67
-
68
-
69
-
70
-
71
-
72
-
73
-
74
-
75
-
76
-
77
-
78
-
79
-
80
-
81
-
82
-
83
-
84
-
85
-
86
-
87
-
88
-
89
-
90
-
91
-
92
-
93
-
94
-
95
-
96
-
97
-
98
-
99
-
100
-
101
-
102
-
103
-
104
-
105
-
106
-
107
-
108
-
109
-
110
-
111
-
112
-
113
-
114
-
115
-
116
-
117
-
118
-
119
-
120
-
121
-
122
-
123
-
124
-
125
-
126
-
127
-
128
-
129
-
130
-
131
-
132
-
133
-
134
-
135
-
136
-
137
-
138
-
139
-
140
-
141
-
142
-
143
-
144
-
145
-
146
-
147
-
148
-
149
-
150
-
151
-
152
-
153
-
154
-
155
-
156
-
157
-
158
-
159
-
160
-
161
-
162
-
163
-
164
-
165
-
166
-
167
-
168
-
169
-
170
-
171
-
172
-
173
-
174
-
175
-
176
-
177
-
178
-
179
-
180
-
181
-
182
-
183
-
184
-
185
-
186
-
187
-
188
-
189
-
190
-
191
-
192
-
193
-
194
-
195
-
196
-
197
-
198
-
199
-
200
-
 201
201 -
 202
202 -
 203
203 -
 204
204 -
 205
205 -
 206
206 -
 207
207 -
 208
208 -
 209
209 -
 210
210 -
 211
211 -
 212
212 -
 213
213 -
 214
214 -
 215
215 -
 216
216 -
 217
217 -
 218
218 -
 219
219 -
 220
220 -
 221
221 -
222
-
223
-
224
-
225
-
226
-
227
-
228
-
229
-
230
-
231
-
232
-
233
-
234
-
235
-
236
-
237
-
238
-
239
-
240
-
241
-
242
-
243
-
244
-
245
-
246
-
247
-
248
-
249
-
250
-
251
-
252
-
253
-
254
-
255
-
256
-
257
-
258
-
259
-
260
-
261
-
262
-
263
-
264
-
265
-
266
-
267
-
268
-
269
-
270
-
271
-
272
-
273
-
274
 |
 |

TYCO INTERNATIONAL LTD.
NOTES TO CONSOLIDATED FINANCIAL STATEMENTS
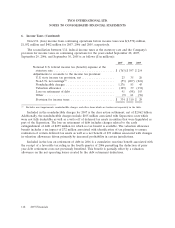
6. Income Taxes (Continued)
Deferred income taxes result from temporary differences between the amount of assets and
liabilities recognized for financial reporting and tax purposes. The components of the net deferred
income tax asset at September 28, 2007 and September 29, 2006 are as follows ($ in millions):
2007 2006
Deferred tax assets:
Accrued liabilities and reserves .............................. $ 382 $ 379
Tax loss and credit carryforwards ............................. 1,433 1,567
Postretirement benefits .................................... 257 287
Deferred revenue ........................................ 271 259
Other ................................................. 338 545
2,681 3,037
Deferred tax liabilities:
Property, plant and equipment ............................... (651) (788)
Intangibles assets ........................................ (270) (205)
Other ................................................. (219) (218)
(1,140) (1,211)
Net deferred tax asset before valuation allowance ................... 1,541 1,826
Valuation allowance ........................................ (666) (800)
Net deferred tax asset ..................................... $ 875 $1,026
At September 28, 2007, the Company had $3,584 million of net operating loss carryforwards in
certain non-U.S. jurisdictions. Of these, $2,581 million have no expiration, and the remaining
$1,003 million will expire in future years through 2027. Due to a favorable tax ruling in the fourth
quarter of 2006, the Company was able to recognize $98 million of net operating loss carryforwards
associated with deduction of debt retirement costs. In the U.S., there were approximately $1,292 million
of federal and $1,715 million of state net operating loss carryforwards at September 28, 2007, which will
expire in future years through 2027.
The valuation allowance for deferred tax assets of $666 million and $800 million at September 28,
2007 and September 29, 2006, respectively, relates principally to the uncertainty of the utilization of
certain deferred tax assets, primarily tax loss and credit carryforwards in various jurisdictions. The
Company believes that it will generate sufficient future taxable income to realize the tax benefits
related to the remaining net deferred tax assets. The valuation allowance was calculated in accordance
with the provisions of SFAS No. 109, ‘‘Accounting for Income Taxes,’’ which requires that a valuation
allowance be established or maintained when it is ‘‘more likely than not’’ that all or a portion of
deferred tax assets will not be realized. At September 28, 2007, approximately $123 million of the
valuation allowance will ultimately reduce goodwill if the net operating losses are utilized.
The Company and its subsidiaries’ income tax returns periodically are examined by various tax
authorities. See ‘‘Income Taxes’’ in Note 16.
2007 Financials 119