ADT 2007 Annual Report Download - page 243
Download and view the complete annual report
Please find page 243 of the 2007 ADT annual report below. You can navigate through the pages in the report by either clicking on the pages listed below, or by using the keyword search tool below to find specific information within the annual report.-
 1
1 -
2
-
3
-
4
-
5
-
6
-
7
-
8
-
9
-
10
-
11
-
12
-
13
-
14
-
15
-
16
-
17
-
18
-
19
-
20
-
21
-
22
-
23
-
24
-
25
-
26
-
27
-
28
-
29
-
30
-
31
-
32
-
33
-
34
-
35
-
36
-
37
-
38
-
39
-
40
-
41
-
42
-
43
-
44
-
45
-
46
-
47
-
48
-
49
-
50
-
51
-
52
-
53
-
54
-
55
-
56
-
57
-
58
-
59
-
60
-
61
-
62
-
63
-
64
-
65
-
66
-
67
-
68
-
69
-
70
-
71
-
72
-
73
-
74
-
75
-
76
-
77
-
78
-
79
-
80
-
81
-
82
-
83
-
84
-
85
-
86
-
87
-
88
-
89
-
90
-
91
-
92
-
93
-
94
-
95
-
96
-
97
-
98
-
99
-
100
-
101
-
102
-
103
-
104
-
105
-
106
-
107
-
108
-
109
-
110
-
111
-
112
-
113
-
114
-
115
-
116
-
117
-
118
-
119
-
120
-
121
-
122
-
123
-
124
-
125
-
126
-
127
-
128
-
129
-
130
-
131
-
132
-
133
-
134
-
135
-
136
-
137
-
138
-
139
-
140
-
141
-
142
-
143
-
144
-
145
-
146
-
147
-
148
-
149
-
150
-
151
-
152
-
153
-
154
-
155
-
156
-
157
-
158
-
159
-
160
-
161
-
162
-
163
-
164
-
165
-
166
-
167
-
168
-
169
-
170
-
171
-
172
-
173
-
174
-
175
-
176
-
177
-
178
-
179
-
180
-
181
-
182
-
183
-
184
-
185
-
186
-
187
-
188
-
189
-
190
-
191
-
192
-
193
-
194
-
195
-
196
-
197
-
198
-
199
-
200
-
201
-
202
-
203
-
204
-
205
-
206
-
207
-
208
-
209
-
210
-
211
-
212
-
213
-
214
-
215
-
216
-
217
-
218
-
219
-
220
-
221
-
222
-
223
-
224
-
225
-
226
-
227
-
228
-
229
-
230
-
231
-
232
-
 233
233 -
 234
234 -
 235
235 -
 236
236 -
 237
237 -
 238
238 -
 239
239 -
 240
240 -
 241
241 -
 242
242 -
 243
243 -
 244
244 -
 245
245 -
 246
246 -
 247
247 -
 248
248 -
 249
249 -
 250
250 -
 251
251 -
 252
252 -
 253
253 -
254
-
255
-
256
-
257
-
258
-
259
-
260
-
261
-
262
-
263
-
264
-
265
-
266
-
267
-
268
-
269
-
270
-
271
-
272
-
273
-
274
 |
 |

TYCO INTERNATIONAL LTD.
NOTES TO CONSOLIDATED FINANCIAL STATEMENTS
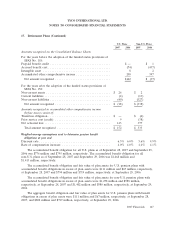
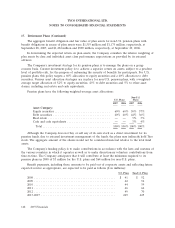
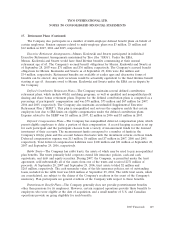
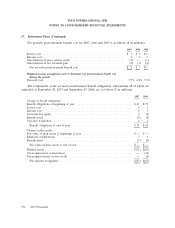
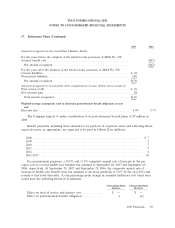
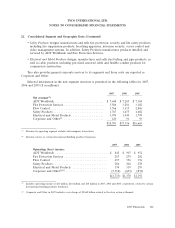
17. Retirement Plans (Continued)
2007 2006
Amounts recognized on the Consolidated Balance Sheets:
For the years before the adoption of the funded status provisions of SFAS No. 158:
Accrued benefit cost ................................................ $(87)
Net amount recognized ............................................ $(87)
For the years after the adoption of the funded status provisions of SFAS No. 158:
Current liabilities .................................................. $ (7)
Non-current liabilities ............................................... (64)
Net amount recognized ............................................ $(71)
Amounts recognized in accumulated other comprehensive income (before taxes) consist of:
Prior service credit ................................................. $ (3)
Net actuarial gain .................................................. (8)
Total amount recognized ........................................... $(11)
Weighted-average assumptions used to determine postretirement benefit obligations at year
end:
Discount rate ..................................................... 6.0% 5.7%
The Company expects to make contributions to its postretirement benefit plans of $7 million in
2008.
Benefit payments, including those amounts to be paid out of corporate assets and reflecting future
expected service as appropriate, are expected to be paid as follows ($ in millions):
2008 .............................................................. $ 7
2009 .............................................................. 7
2010 .............................................................. 7
2011 .............................................................. 7
2012 .............................................................. 6
2013-2017 ........................................................... 29
For measurement purposes, a 10.0% and 11.4% composite annual rate of increase in the per
capita cost of covered health care benefits was assumed at September 28, 2007 and September 29,
2006, respectively. At September 28, 2007 and September 29, 2006, the composite annual rate of
increase in health care benefit costs was assumed to decrease gradually to 5.0% by the year 2013 and
remain at that level thereafter. A one-percentage-point change in assumed healthcare cost trend rates
would have the following effects ($ in millions):
1-Percentage-Point 1-Percentage-Point
Increase Decrease
Effect on total of service and interest cost ............. $ — $ —
Effect on postretirement benefit obligation ............ 4 (4)
2007 Financials 151