ADT 2007 Annual Report Download - page 148
Download and view the complete annual report
Please find page 148 of the 2007 ADT annual report below. You can navigate through the pages in the report by either clicking on the pages listed below, or by using the keyword search tool below to find specific information within the annual report.-
 1
1 -
2
-
3
-
4
-
5
-
6
-
7
-
8
-
9
-
10
-
11
-
12
-
13
-
14
-
15
-
16
-
17
-
18
-
19
-
20
-
21
-
22
-
23
-
24
-
25
-
26
-
27
-
28
-
29
-
30
-
31
-
32
-
33
-
34
-
35
-
36
-
37
-
38
-
39
-
40
-
41
-
42
-
43
-
44
-
45
-
46
-
47
-
48
-
49
-
50
-
51
-
52
-
53
-
54
-
55
-
56
-
57
-
58
-
59
-
60
-
61
-
62
-
63
-
64
-
65
-
66
-
67
-
68
-
69
-
70
-
71
-
72
-
73
-
74
-
75
-
76
-
77
-
78
-
79
-
80
-
81
-
82
-
83
-
84
-
85
-
86
-
87
-
88
-
89
-
90
-
91
-
92
-
93
-
94
-
95
-
96
-
97
-
98
-
99
-
100
-
101
-
102
-
103
-
104
-
105
-
106
-
107
-
108
-
109
-
110
-
111
-
112
-
113
-
114
-
115
-
116
-
117
-
118
-
119
-
120
-
121
-
122
-
123
-
124
-
125
-
126
-
127
-
128
-
129
-
130
-
131
-
132
-
133
-
134
-
135
-
136
-
137
-
 138
138 -
 139
139 -
 140
140 -
 141
141 -
 142
142 -
 143
143 -
 144
144 -
 145
145 -
 146
146 -
 147
147 -
 148
148 -
 149
149 -
 150
150 -
 151
151 -
 152
152 -
 153
153 -
 154
154 -
 155
155 -
 156
156 -
 157
157 -
 158
158 -
159
-
160
-
161
-
162
-
163
-
164
-
165
-
166
-
167
-
168
-
169
-
170
-
171
-
172
-
173
-
174
-
175
-
176
-
177
-
178
-
179
-
180
-
181
-
182
-
183
-
184
-
185
-
186
-
187
-
188
-
189
-
190
-
191
-
192
-
193
-
194
-
195
-
196
-
197
-
198
-
199
-
200
-
201
-
202
-
203
-
204
-
205
-
206
-
207
-
208
-
209
-
210
-
211
-
212
-
213
-
214
-
215
-
216
-
217
-
218
-
219
-
220
-
221
-
222
-
223
-
224
-
225
-
226
-
227
-
228
-
229
-
230
-
231
-
232
-
233
-
234
-
235
-
236
-
237
-
238
-
239
-
240
-
241
-
242
-
243
-
244
-
245
-
246
-
247
-
248
-
249
-
250
-
251
-
252
-
253
-
254
-
255
-
256
-
257
-
258
-
259
-
260
-
261
-
262
-
263
-
264
-
265
-
266
-
267
-
268
-
269
-
270
-
271
-
272
-
273
-
274
 |
 |

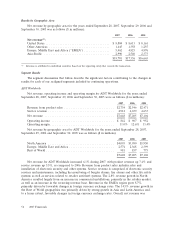
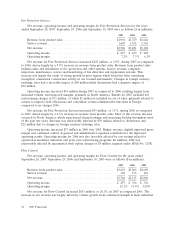
Fire Protection Services
Net revenue, operating income and operating margin for Fire Protection Services for the years
ended September 28, 2007, September 29, 2006 and September 30, 2005 were as follows ($ in millions):
2007 2006 2005
Revenue from product sales ............................. $1,901 $1,729 $1,626
Service revenue ...................................... 1,605 1,552 1,556
Net revenue ........................................ $3,506 $3,281 $3,182
Operating income .................................... $ 253 $ 239 $ 202
Operating margin ..................................... 7.2% 7.3% 6.3%
Net revenue for Fire Protection Services increased $225 million, or 6.9%, during 2007 as compared
to 2006, driven largely by a 9.9% increase in revenue from product sales. Revenue from product sales
includes sales and installation of fire protection and other systems. Service revenue comprises
inspection, maintenance, service and monitoring of fire detection and suppression systems. This
increase was largely the result of strong growth in most regions which benefited from continuing
strength in commercial construction activity in our focused end-markets. Changes in foreign currency
exchange rates had a favorable impact of $99 million while divestitures had a negative impact of
$30 million.
Operating income increased $14 million during 2007 as compared to 2006 resulting largely from
increased volume, and improved margins, primarily in North America. Results for 2007 included net
restructuring charges of $33 million, of which $1 million is included in cost of sales, primarily related to
actions to improve field efficiencies and consolidate certain administrative functions in Europe,
compared to no charges 2006.
Net revenue for Fire Protection Services increased $99 million, or 3.1%, during 2006 as compared
to 2005, driven largely by a 6.3% increase in revenue from product sales. Most of the revenue increase
occurred in North America, which experienced strong bookings and increasing backlog throughout most
of the past two years. Revenue was unfavorably affected by $39 million related to divestitures and
$22 million due to changes in foreign currency exchange rates.
Operating income increased $37 million in 2006 over 2005. Higher revenue, slightly improved gross
margin and continued control of general and administrative expenses contributed to the improved
operating results. Operating income for 2006 was also favorably affected by cost savings related to
operational excellence initiatives and prior year restructuring programs. In addition, 2006 was
unfavorably affected by incremental stock option charges of $8 million required under SFAS No. 123R.
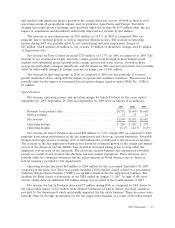
Flow Control
Net revenue, operating income and operating margin for Flow Control for the years ended
September 28, 2007, September 29, 2006 and September 30, 2005 were as follows ($ in millions):
2007 2006 2005
Revenue from product sales ............................. $3,618 $3,002 $2,690
Service revenue ...................................... 148 133 116
Net revenue ........................................ $3,766 $3,135 $2,806
Operating income .................................... $ 457 $ 356 $ 336
Operating margin ..................................... 12.1% 11.4% 12.0%
Net revenue for Flow Control increased $631 million, or 20.1%, in 2007 as compared 2006. The
increase in net revenue was largely driven by volume growth from continued strength in most industrial
56 2007 Financials