ADT 2007 Annual Report Download - page 194
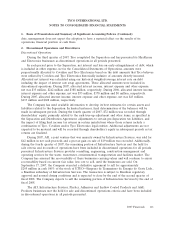
Download and view the complete annual report
Please find page 194 of the 2007 ADT annual report below. You can navigate through the pages in the report by either clicking on the pages listed below, or by using the keyword search tool below to find specific information within the annual report.-
 1
1 -
2
-
3
-
4
-
5
-
6
-
7
-
8
-
9
-
10
-
11
-
12
-
13
-
14
-
15
-
16
-
17
-
18
-
19
-
20
-
21
-
22
-
23
-
24
-
25
-
26
-
27
-
28
-
29
-
30
-
31
-
32
-
33
-
34
-
35
-
36
-
37
-
38
-
39
-
40
-
41
-
42
-
43
-
44
-
45
-
46
-
47
-
48
-
49
-
50
-
51
-
52
-
53
-
54
-
55
-
56
-
57
-
58
-
59
-
60
-
61
-
62
-
63
-
64
-
65
-
66
-
67
-
68
-
69
-
70
-
71
-
72
-
73
-
74
-
75
-
76
-
77
-
78
-
79
-
80
-
81
-
82
-
83
-
84
-
85
-
86
-
87
-
88
-
89
-
90
-
91
-
92
-
93
-
94
-
95
-
96
-
97
-
98
-
99
-
100
-
101
-
102
-
103
-
104
-
105
-
106
-
107
-
108
-
109
-
110
-
111
-
112
-
113
-
114
-
115
-
116
-
117
-
118
-
119
-
120
-
121
-
122
-
123
-
124
-
125
-
126
-
127
-
128
-
129
-
130
-
131
-
132
-
133
-
134
-
135
-
136
-
137
-
138
-
139
-
140
-
141
-
142
-
143
-
144
-
145
-
146
-
147
-
148
-
149
-
150
-
151
-
152
-
153
-
154
-
155
-
156
-
157
-
158
-
159
-
160
-
161
-
162
-
163
-
164
-
165
-
166
-
167
-
168
-
169
-
170
-
171
-
172
-
173
-
174
-
175
-
176
-
177
-
178
-
179
-
180
-
181
-
182
-
183
-
 184
184 -
 185
185 -
 186
186 -
 187
187 -
 188
188 -
 189
189 -
 190
190 -
 191
191 -
 192
192 -
 193
193 -
 194
194 -
 195
195 -
 196
196 -
 197
197 -
 198
198 -
 199
199 -
 200
200 -
 201
201 -
 202
202 -
 203
203 -
 204
204 -
205
-
206
-
207
-
208
-
209
-
210
-
211
-
212
-
213
-
214
-
215
-
216
-
217
-
218
-
219
-
220
-
221
-
222
-
223
-
224
-
225
-
226
-
227
-
228
-
229
-
230
-
231
-
232
-
233
-
234
-
235
-
236
-
237
-
238
-
239
-
240
-
241
-
242
-
243
-
244
-
245
-
246
-
247
-
248
-
249
-
250
-
251
-
252
-
253
-
254
-
255
-
256
-
257
-
258
-
259
-
260
-
261
-
262
-
263
-
264
-
265
-
266
-
267
-
268
-
269
-
270
-
271
-
272
-
273
-
274
 |
 |

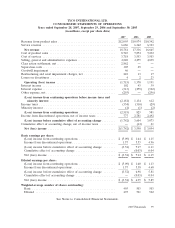
TYCO INTERNATIONAL LTD.
CONSOLIDATED STATEMENTS OF CASH FLOWS
Years Ended September 28, 2007, September 29, 2006 and September 30, 2005
(in millions)
2007 2006 2005
Cash Flows From Operating Activities:
Net (loss) income ....................................................... $(1,742) $ 3,590 $ 3,094
Income from discontinued operations, net of income taxes ............................. (777) (2,781) (2,492)
Cumulative effect of accounting change, net of income taxes ............................ — 14 (21)
(Loss) income from continuing operations ......................................... (2,519) 823 581
Adjustments to reconcile net cash provided by operating activities:
Depreciation and amortization .............................................. 1,151 1,182 1,204
Non-cash compensation expense ............................................. 173 151 72
Deferred income taxes ................................................... (11) (414) (227)
Provision for losses on accounts receivable and inventory .............................. 94 56 102
Loss on the retirement of debt .............................................. 259 1 405
Goodwill impairment .................................................... 46 — —
Non-cash restructuring and asset impairment charges, net .............................. 24 2 2
Losses on divestitures ................................................... 4 2 23
Gains on investments, net ................................................. (10) (12) —
Debt and refinancing cost amortization ......................................... 7 6 12
Other non-cash items .................................................... 31 (30) 28
Changes in assets and liabilities, net of the effects of acquisitions and divestitures:
Accounts receivable, net ................................................. (128) (151) (190)
Contracts in progress .................................................. (47) (50) 2
Inventories ........................................................ (166) (106) (104)
Other current assets ................................................... 154 207 (53)
Accounts payable ..................................................... 54 172 238
Accrued and other liabilities .............................................. (56) (166) 126
Income taxes, net ..................................................... (244) 408 377
Class action settlement liability ............................................. 2,992 — —
Other ............................................................ 28 (88) (271)
Net cash provided by operating activities ..................................... 1,836 1,993 2,327
Net cash provided by discontinued operating activities ............................. 2,475 3,574 3,891
Cash Flows From Investing Activities:
Capital expenditures ...................................................... (669) (558) (516)
Proceeds from disposal of assets .............................................. 23 39 53
Acquisition of customer accounts (ADT dealer program) ................................ (409) (373) (328)
Acquisition of businesses, net of cash acquired ...................................... (31) (5) (6)
Divestiture of businesses, net of cash retained ...................................... 8 11 21
Class action settlement escrow ................................................ (2,960) — —
Liquidation of rabbi trust investments ........................................... 271 — —
Decrease (increase) in investments ............................................. 4 58 (314)
Decrease in restricted cash .................................................. 5 20 7
Other .............................................................. 14 (20) (12)
Net cash (used in) provided by investing activities ................................ (3,744) (828) (1,095)
Net cash used in discontinued investing activities ................................ (805) (599) (659)
Cash Flows From Financing Activities:
Proceeds from issuance of short-term debt ........................................ 1,517 4 2
Repayment of short-term debt ................................................ (1,151) (28) (10)
Proceeds from issuance of long-term debt ......................................... 308 700 —
Repayment of long-term debt, including debt tenders .................................. (6,602) (1,766) (4,782)
Proceeds from exercise of share options .......................................... 406 249 226
Dividends paid ......................................................... (791) (806) (628)
Repurchase of common shares by subsidiary ....................................... (727) (2,544) (300)
Transfer from discontinued operations ........................................... 8,567 2,429 3,080
Other .............................................................. 12 (10) (11)
Net cash provided by (used in) financing activities ................................ 1,539 (1,772) (2,423)
Net cash used in discontinued financing activities ................................ (932) (2,687) (3,375)
Effect of currency translation on cash ........................................... 70 21 52
Effect of currency translation on cash related to discontinued operations ...................... 33 21 13
Net increase (decrease) in cash and cash equivalents .................................. 472 (277) (1,269)
Less: net (increase) decrease in cash related to discontinued operations ....................... (771) (309) 130
Cash and cash equivalents at beginning of year ..................................... 2,193 2,779 3,918
Cash and cash equivalents at end of year ......................................... $1,894 $ 2,193 $ 2,779
Supplementary Cash Flow Information:
Interest paid .......................................................... $ 317 $ 285 $ 338
Income taxes paid, net of refunds .............................................. $ 650 $ 316 $ 209
See Notes to Consolidated Financial Statements.
102 2007 Financials