ADT 2007 Annual Report Download - page 149
Download and view the complete annual report
Please find page 149 of the 2007 ADT annual report below. You can navigate through the pages in the report by either clicking on the pages listed below, or by using the keyword search tool below to find specific information within the annual report.-
 1
1 -
2
-
3
-
4
-
5
-
6
-
7
-
8
-
9
-
10
-
11
-
12
-
13
-
14
-
15
-
16
-
17
-
18
-
19
-
20
-
21
-
22
-
23
-
24
-
25
-
26
-
27
-
28
-
29
-
30
-
31
-
32
-
33
-
34
-
35
-
36
-
37
-
38
-
39
-
40
-
41
-
42
-
43
-
44
-
45
-
46
-
47
-
48
-
49
-
50
-
51
-
52
-
53
-
54
-
55
-
56
-
57
-
58
-
59
-
60
-
61
-
62
-
63
-
64
-
65
-
66
-
67
-
68
-
69
-
70
-
71
-
72
-
73
-
74
-
75
-
76
-
77
-
78
-
79
-
80
-
81
-
82
-
83
-
84
-
85
-
86
-
87
-
88
-
89
-
90
-
91
-
92
-
93
-
94
-
95
-
96
-
97
-
98
-
99
-
100
-
101
-
102
-
103
-
104
-
105
-
106
-
107
-
108
-
109
-
110
-
111
-
112
-
113
-
114
-
115
-
116
-
117
-
118
-
119
-
120
-
121
-
122
-
123
-
124
-
125
-
126
-
127
-
128
-
129
-
130
-
131
-
132
-
133
-
134
-
135
-
136
-
137
-
138
-
 139
139 -
 140
140 -
 141
141 -
 142
142 -
 143
143 -
 144
144 -
 145
145 -
 146
146 -
 147
147 -
 148
148 -
 149
149 -
 150
150 -
 151
151 -
 152
152 -
 153
153 -
 154
154 -
 155
155 -
 156
156 -
 157
157 -
 158
158 -
 159
159 -
160
-
161
-
162
-
163
-
164
-
165
-
166
-
167
-
168
-
169
-
170
-
171
-
172
-
173
-
174
-
175
-
176
-
177
-
178
-
179
-
180
-
181
-
182
-
183
-
184
-
185
-
186
-
187
-
188
-
189
-
190
-
191
-
192
-
193
-
194
-
195
-
196
-
197
-
198
-
199
-
200
-
201
-
202
-
203
-
204
-
205
-
206
-
207
-
208
-
209
-
210
-
211
-
212
-
213
-
214
-
215
-
216
-
217
-
218
-
219
-
220
-
221
-
222
-
223
-
224
-
225
-
226
-
227
-
228
-
229
-
230
-
231
-
232
-
233
-
234
-
235
-
236
-
237
-
238
-
239
-
240
-
241
-
242
-
243
-
244
-
245
-
246
-
247
-
248
-
249
-
250
-
251
-
252
-
253
-
254
-
255
-
256
-
257
-
258
-
259
-
260
-
261
-
262
-
263
-
264
-
265
-
266
-
267
-
268
-
269
-
270
-
271
-
272
-
273
-
274
 |
 |

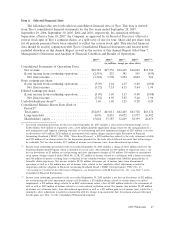
end markets with significant project growth in the energy and water sectors. Growth in these sectors
was strong across all geographical regions, and, in particular, Asia-Pacific and Europe. Favorable
changes in foreign currency exchange rates positively impacted revenue by $197 million while the net
impact of acquisitions and divestitures unfavorably impacted net revenue by $16 million.
The increase in operating income of $101 million, or 28.4%, in 2007 as compared 2006 was
primarily due to revenue growth, as well as improved utilization rates. The increase in operating
income during 2007 was partially offset by net restructuring and asset impairment charges of
$25 million, which includes $6 million in cost of sales, $3 million of divestiture charges, and $1 million
of Separation costs.
Net revenue for Flow Control increased $329 million, or 11.7%, in 2006 as compared to 2005. The
increase in net revenue was largely driven by volume growth from strength in most industrial end
markets with substantial project growth in the energy, process and water sectors. Growth in these
sectors was particularly strong in Asia-Pacific and the Americas. The increases in revenue were partially
offset by unfavorable changes in foreign currency exchange rates of $43 million.
The increase in operating income in 2006 as compared to 2005 was due primarily to revenue
growth mentioned above, along with the impact of operational excellence initiatives. This increase was
partially offset by the impact of incremental stock option charges required under SFAS No. 123R of
$7 million.
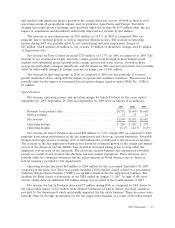
Safety Products
Net revenue, operating income and operating margin for Safety Products for the years ended
September 28, 2007, September 29, 2006 and September 30, 2005 were as follows ($ in millions):
2007 2006 2005
Revenue from product sales ............................. $1,752 $1,660 $1,668
Service revenue ...................................... 15 15 14
Net revenue ........................................ $1,767 $1,675 $1,682
Operating income .................................... $ 286 $ 202 $ 278
Operating margin ..................................... 16.2% 12.1% 16.5%
Net revenue for Safety Products increased $92 million, or 5.5%, during 2007 as compared to 2006
primarily from strong performance in the fire suppression and electronic security businesses. Favorable
changes in foreign currency exchange rates of $48 million also contributed to the increase in revenue.
The increase in the fire suppression business was driven by continued growth in the energy and marine
sectors in the Americas and the Middle East as well as increased selling prices to help offset the
significant cost increase of raw materials. The electronic security business also experienced favorable
growth as a result of new product introductions and new market expansions. These increases were
partially offset by continued softness in the life safety business in North America due to delays of
federal assistance provided to fire departments.
Operating income increased $84 million to $286 million for the year ended September 28, 2007
compared to the prior year. Prior year results included a $100 million charge related to a pre-existing
Voluntary Replacement Program (‘‘VRP’’) for sprinkler heads in the fire suppression business. The
deadline for filing claims to participate in the VRP ended on August 31, 2007. In light of the most
current claims data, an additional $10 million charge was recorded in the fourth quarter of 2007.
Net revenue for Safety Products decreased $7 million during 2006 as compared to 2005 driven by
the unfavorable impact of $56 million from divested businesses as well as delays of federal assistance
provided to fire departments which unfavorably impacted the life safety business. These decreases were
partially offset by stronger performance in the fire suppression business as a result of favorable market
2007 Financials 57