ADT 2007 Annual Report Download - page 161
Download and view the complete annual report
Please find page 161 of the 2007 ADT annual report below. You can navigate through the pages in the report by either clicking on the pages listed below, or by using the keyword search tool below to find specific information within the annual report.-
 1
1 -
2
-
3
-
4
-
5
-
6
-
7
-
8
-
9
-
10
-
11
-
12
-
13
-
14
-
15
-
16
-
17
-
18
-
19
-
20
-
21
-
22
-
23
-
24
-
25
-
26
-
27
-
28
-
29
-
30
-
31
-
32
-
33
-
34
-
35
-
36
-
37
-
38
-
39
-
40
-
41
-
42
-
43
-
44
-
45
-
46
-
47
-
48
-
49
-
50
-
51
-
52
-
53
-
54
-
55
-
56
-
57
-
58
-
59
-
60
-
61
-
62
-
63
-
64
-
65
-
66
-
67
-
68
-
69
-
70
-
71
-
72
-
73
-
74
-
75
-
76
-
77
-
78
-
79
-
80
-
81
-
82
-
83
-
84
-
85
-
86
-
87
-
88
-
89
-
90
-
91
-
92
-
93
-
94
-
95
-
96
-
97
-
98
-
99
-
100
-
101
-
102
-
103
-
104
-
105
-
106
-
107
-
108
-
109
-
110
-
111
-
112
-
113
-
114
-
115
-
116
-
117
-
118
-
119
-
120
-
121
-
122
-
123
-
124
-
125
-
126
-
127
-
128
-
129
-
130
-
131
-
132
-
133
-
134
-
135
-
136
-
137
-
138
-
139
-
140
-
141
-
142
-
143
-
144
-
145
-
146
-
147
-
148
-
149
-
150
-
 151
151 -
 152
152 -
 153
153 -
 154
154 -
 155
155 -
 156
156 -
 157
157 -
 158
158 -
 159
159 -
 160
160 -
 161
161 -
 162
162 -
 163
163 -
 164
164 -
 165
165 -
 166
166 -
 167
167 -
 168
168 -
 169
169 -
 170
170 -
 171
171 -
172
-
173
-
174
-
175
-
176
-
177
-
178
-
179
-
180
-
181
-
182
-
183
-
184
-
185
-
186
-
187
-
188
-
189
-
190
-
191
-
192
-
193
-
194
-
195
-
196
-
197
-
198
-
199
-
200
-
201
-
202
-
203
-
204
-
205
-
206
-
207
-
208
-
209
-
210
-
211
-
212
-
213
-
214
-
215
-
216
-
217
-
218
-
219
-
220
-
221
-
222
-
223
-
224
-
225
-
226
-
227
-
228
-
229
-
230
-
231
-
232
-
233
-
234
-
235
-
236
-
237
-
238
-
239
-
240
-
241
-
242
-
243
-
244
-
245
-
246
-
247
-
248
-
249
-
250
-
251
-
252
-
253
-
254
-
255
-
256
-
257
-
258
-
259
-
260
-
261
-
262
-
263
-
264
-
265
-
266
-
267
-
268
-
269
-
270
-
271
-
272
-
273
-
274
 |
 |

timing of estimated future cash flows and assumed discount rates, reflecting varying degrees of
perceived risk. Since judgment is involved in determining the fair value and useful lives of long-lived
assets, there is a risk that the carrying value of our long-lived assets may be overstated or understated.
Pension and Postretirement Benefits—Our pension expense and obligations are developed from
actuarial valuations. Two critical assumptions in determining pension expense and obligations are the
discount rate and expected long-term return on plan assets. We evaluate these assumptions at least
annually. Other assumptions reflect demographic factors such as retirement, mortality and turnover and
are evaluated periodically and updated to reflect our actual experience. Actual results may differ from
actuarial assumptions. The discount rate represents the market rate for high-quality fixed income
investments and is used to calculate the present value of the expected future cash flows for benefit
obligations under our pension plans. A decrease in the discount rate increases the present value of
pension benefit obligations. A 25 basis point decrease in the discount rate would increase our present
value of pension obligations by approximately $90 million. We consider the current and expected asset
allocations of our pension plans, as well as historical and expected long-term rates of return on those
types of plan assets, in determining the expected long-term return on plan assets. A 50 basis point
decrease in the expected long-term return on plan assets would increase our pension expense by
approximately $10 million.
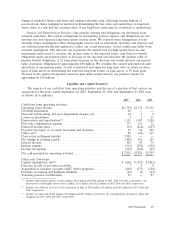
Liquidity and Capital Resources
The sources of our cash flow from operating activities and the use of a portion of that cash in our
operations for the years ended September 28, 2007, September 29, 2006 and September 30, 2005 were
as follows ($ in millions):
2007 2006 2005
Cash flows from operating activities:
Operating (loss) income ...................................... $(1,715) $1,370 $1,191
Goodwill impairment ........................................ 46 — —
Non-cash restructuring and asset impairment charges, net ............. 24 2 2
Losses on divestitures ........................................ 4 2 23
Depreciation and amortization(1) ................................ 1,151 1,182 1,204
Non-cash compensation expense ................................ 173 151 72
Deferred income taxes ....................................... (11) (414) (227)
Provision for losses on accounts receivable and inventory .............. 94 56 102
Other, net(2) .............................................. 28 (36) 147
Class action settlement liability ................................. 2,992 — —
Net change in working capital .................................. (405) 226 125
Interest income ............................................ 102 43 39
Interest expense ............................................ (313) (279) (322)
Income tax expense ......................................... (334) (310) (29)
Net cash provided by operating activities .......................... $1,836 $1,993 $2,327
Other cash flow items:
Capital expenditures, net(3) .................................... $ (646) $ (519) $ (463)
Decrease in sale of accounts receivable ........................... 7 8 8
Acquisition of customer accounts (ADT dealer program) .............. (409) (373) (328)
Purchase accounting and holdback liabilities ....................... (10) (7) (14)
Voluntary pension contributions ................................ 23 — 83
(1) Includes depreciation expense of $638 million, $665 million and $676 million in 2007, 2006 and 2005, respectively, and
amortization of intangible assets of $513 million, $517 million and $528 million in 2007, 2006 and 2005, respectively.
(2) Includes the add-back of losses on the retirement of debt of $259 million, $1 million and $405 million in 2007, 2006 and
2005, respectively.
(3) Includes net proceeds of $23 million, $39 million and $53 million received for the sale/disposition of property, plant and
equipment in 2007, 2006 and 2005, respectively.
2007 Financials 69