ADT 2007 Annual Report Download - page 49
Download and view the complete annual report
Please find page 49 of the 2007 ADT annual report below. You can navigate through the pages in the report by either clicking on the pages listed below, or by using the keyword search tool below to find specific information within the annual report.-
 1
1 -
2
-
3
-
4
-
5
-
6
-
7
-
8
-
9
-
10
-
11
-
12
-
13
-
14
-
15
-
16
-
17
-
18
-
19
-
20
-
21
-
22
-
23
-
24
-
25
-
26
-
27
-
28
-
29
-
30
-
31
-
32
-
33
-
34
-
35
-
36
-
37
-
38
-
 39
39 -
 40
40 -
 41
41 -
 42
42 -
 43
43 -
 44
44 -
 45
45 -
 46
46 -
 47
47 -
 48
48 -
 49
49 -
 50
50 -
 51
51 -
 52
52 -
 53
53 -
 54
54 -
 55
55 -
 56
56 -
 57
57 -
 58
58 -
 59
59 -
60
-
61
-
62
-
63
-
64
-
65
-
66
-
67
-
68
-
69
-
70
-
71
-
72
-
73
-
74
-
75
-
76
-
77
-
78
-
79
-
80
-
81
-
82
-
83
-
84
-
85
-
86
-
87
-
88
-
89
-
90
-
91
-
92
-
93
-
94
-
95
-
96
-
97
-
98
-
99
-
100
-
101
-
102
-
103
-
104
-
105
-
106
-
107
-
108
-
109
-
110
-
111
-
112
-
113
-
114
-
115
-
116
-
117
-
118
-
119
-
120
-
121
-
122
-
123
-
124
-
125
-
126
-
127
-
128
-
129
-
130
-
131
-
132
-
133
-
134
-
135
-
136
-
137
-
138
-
139
-
140
-
141
-
142
-
143
-
144
-
145
-
146
-
147
-
148
-
149
-
150
-
151
-
152
-
153
-
154
-
155
-
156
-
157
-
158
-
159
-
160
-
161
-
162
-
163
-
164
-
165
-
166
-
167
-
168
-
169
-
170
-
171
-
172
-
173
-
174
-
175
-
176
-
177
-
178
-
179
-
180
-
181
-
182
-
183
-
184
-
185
-
186
-
187
-
188
-
189
-
190
-
191
-
192
-
193
-
194
-
195
-
196
-
197
-
198
-
199
-
200
-
201
-
202
-
203
-
204
-
205
-
206
-
207
-
208
-
209
-
210
-
211
-
212
-
213
-
214
-
215
-
216
-
217
-
218
-
219
-
220
-
221
-
222
-
223
-
224
-
225
-
226
-
227
-
228
-
229
-
230
-
231
-
232
-
233
-
234
-
235
-
236
-
237
-
238
-
239
-
240
-
241
-
242
-
243
-
244
-
245
-
246
-
247
-
248
-
249
-
250
-
251
-
252
-
253
-
254
-
255
-
256
-
257
-
258
-
259
-
260
-
261
-
262
-
263
-
264
-
265
-
266
-
267
-
268
-
269
-
270
-
271
-
272
-
273
-
274
 |
 |
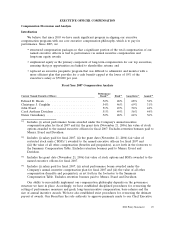
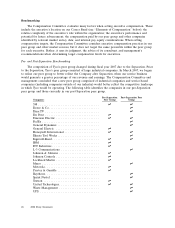
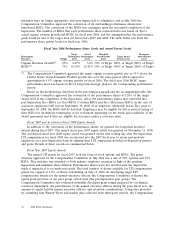
We developed the post-Separation peer group by focusing on companies in the S&P 500 Index. We
believe that these companies represent our primary competitors for capital, executive talent and, in
some cases, business. We selected the companies in the post-Separation peer group by analyzing (i) the
company’s rank within the S&P 500 Index, (ii) the company’s enterprise value, asset value and equity
market value, (iii) the company’s annual revenue, operating income, cash flow from operations and free
cash flow, (iv) the number of people employed by the company, (v) the company’s return on invested
capital, (vi) the company’s three-year total shareholder return and three-year compound annualized
growth in sales and earnings, and (vii) the company’s business lines and the extent that they overlap
Tyco’s business lines. Management reviewed the proposed post-Separation peer group with the
Compensation Committee and its independent consultant in July 2007, and in September and
December the Compensation Committee approved the group for fiscal year 2008 benchmarking
purposes.
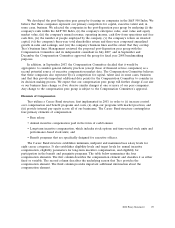
In addition, in September 2007, the Compensation Committee decided that it would be
appropriate to consider general industry practices (except those of financial service companies) as a
second potential source of executive compensation market data. The Compensation Committee believes
that these companies also represent Tyco’s competition for capital, talent and, in some cases, business;
and that they provide important additional data points for the Compensation Committee to consider in
its decision making process. We expect that our compensation peer group will further change if our size
or our business lines change or if we observe similar changes at one or more of our peer companies.
Any change to the compensation peer group is subject to the Compensation Committee’s approval.
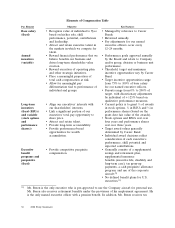
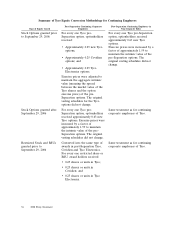
Elements of Compensation
Tyco utilizes a Career Band structure, first implemented in 2003, in order to (i) increase control
over compensation and benefit programs and costs, (ii) align our programs with market practices, and
(iii) provide internal pay equity across all of our businesses. The Career Band structure contemplates
four primary elements of compensation:
• Base salary;
• Annual incentive compensation paid in the form of cash bonuses;
• Long-term incentive compensation, which includes stock options and time-vested stock units and
performance-based stock units; and
• Benefit programs that are specifically designed for executive officers.
The Career Band structure establishes minimum, midpoint and maximum base salary levels for
eight career categories. It also establishes eligibility levels and target levels for annual incentive
compensation, eligibility parameters for long-term incentive compensation, and eligibility for
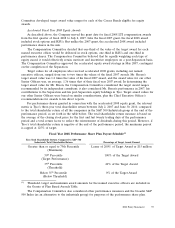
participation in the benefit and perquisite programs. The table below summarizes the four
compensation elements. The first column describes the compensation element and classifies it as either
fixed or variable. The second column describes the underlying reason that Tyco provides the
compensation element. The third column provides important additional information about the
compensation element.
2008 Proxy Statement 29