ADT 2007 Annual Report Download - page 52
Download and view the complete annual report
Please find page 52 of the 2007 ADT annual report below. You can navigate through the pages in the report by either clicking on the pages listed below, or by using the keyword search tool below to find specific information within the annual report.-
 1
1 -
2
-
3
-
4
-
5
-
6
-
7
-
8
-
9
-
10
-
11
-
12
-
13
-
14
-
15
-
16
-
17
-
18
-
19
-
20
-
21
-
22
-
23
-
24
-
25
-
26
-
27
-
28
-
29
-
30
-
31
-
32
-
33
-
34
-
35
-
36
-
37
-
38
-
39
-
40
-
41
-
 42
42 -
 43
43 -
 44
44 -
 45
45 -
 46
46 -
 47
47 -
 48
48 -
 49
49 -
 50
50 -
 51
51 -
 52
52 -
 53
53 -
 54
54 -
 55
55 -
 56
56 -
 57
57 -
 58
58 -
 59
59 -
 60
60 -
 61
61 -
 62
62 -
63
-
64
-
65
-
66
-
67
-
68
-
69
-
70
-
71
-
72
-
73
-
74
-
75
-
76
-
77
-
78
-
79
-
80
-
81
-
82
-
83
-
84
-
85
-
86
-
87
-
88
-
89
-
90
-
91
-
92
-
93
-
94
-
95
-
96
-
97
-
98
-
99
-
100
-
101
-
102
-
103
-
104
-
105
-
106
-
107
-
108
-
109
-
110
-
111
-
112
-
113
-
114
-
115
-
116
-
117
-
118
-
119
-
120
-
121
-
122
-
123
-
124
-
125
-
126
-
127
-
128
-
129
-
130
-
131
-
132
-
133
-
134
-
135
-
136
-
137
-
138
-
139
-
140
-
141
-
142
-
143
-
144
-
145
-
146
-
147
-
148
-
149
-
150
-
151
-
152
-
153
-
154
-
155
-
156
-
157
-
158
-
159
-
160
-
161
-
162
-
163
-
164
-
165
-
166
-
167
-
168
-
169
-
170
-
171
-
172
-
173
-
174
-
175
-
176
-
177
-
178
-
179
-
180
-
181
-
182
-
183
-
184
-
185
-
186
-
187
-
188
-
189
-
190
-
191
-
192
-
193
-
194
-
195
-
196
-
197
-
198
-
199
-
200
-
201
-
202
-
203
-
204
-
205
-
206
-
207
-
208
-
209
-
210
-
211
-
212
-
213
-
214
-
215
-
216
-
217
-
218
-
219
-
220
-
221
-
222
-
223
-
224
-
225
-
226
-
227
-
228
-
229
-
230
-
231
-
232
-
233
-
234
-
235
-
236
-
237
-
238
-
239
-
240
-
241
-
242
-
243
-
244
-
245
-
246
-
247
-
248
-
249
-
250
-
251
-
252
-
253
-
254
-
255
-
256
-
257
-
258
-
259
-
260
-
261
-
262
-
263
-
264
-
265
-
266
-
267
-
268
-
269
-
270
-
271
-
272
-
273
-
274
 |
 |
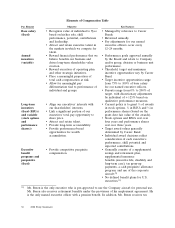
businesses; his performance and potential; the base salaries paid to similarly situated executives
identified by market data; and the base salaries paid to our other business unit presidents.
Annual Incentive Compensation
The annual incentive compensation, or performance bonus, for our executives is generally paid
under the annual incentive plan, which is an element of the Company’s 2004 Stock and Incentive Plan
(the ‘‘2004 SIP’’). However, in special circumstances such as those described below, discretionary
bonuses may be paid outside the scope of the 2004 SIP. Annual incentive compensation generally takes
the form of cash bonuses for all of our Senior Officers. The annual incentive plan is structured as
follows, although changes are made by the Board from year to year to reflect changing business needs
and competitive circumstances:
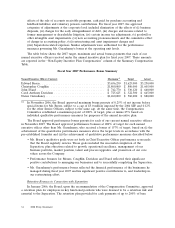
• At the beginning of the fiscal year, the Board sets a minimum performance measure that must
be met for our Senior Officers to receive performance bonuses. For fiscal 2007, this minimum
performance threshold was 25% of targeted adjusted net income. Adjusted net income consists
of net income before the special items described in the footnote to the table below. The Board
also approves individual maximum bonus amounts for each of our Senior Officers. For fiscal
2007, the maximum bonus for Mr. Breen equaled 0.25% of the Company’s net income, subject
to a cap of $5.0 million imposed by the 2004 SIP, and for our other Senior Officers, the
maximum was set at 0.12% of net income, subject to the same cap. At the same time, the
Compensation Committee sets threshold, target and maximum performance bonus amounts for
purposes of the annual incentive plan under the 2004 SIP. For fiscal 2007, bonus targets were set
at a multiple of base salary for our named executive officers, and maximum and threshold
amounts were 200% and 50% of target, respectively. In each case, the amount is subject to plus
or minus 25% based on the Board’s evaluation of individual qualitative criteria.
• Also at the beginning of the fiscal year, the Compensation Committee chooses performance
measures and related targets for the corporate and group levels of the organization. These
performance measures and targets are used by the Board as a guideline for determining target
bonuses for our Senior Officers. The measures and targets exclude certain items that do not
reflect the personal performance of the named executive officers, as described in the footnote to
the table below.
• After the close of the fiscal year, actual performance against the pre-established measures is
calculated for the Company and each group, division and business unit. Management and the
Board review results and take into account factors that affect financial results but are not part of
the financial calculation. Such factors include, for example, the completion of significant strategic
projects such as the Separation, and events which could result in ‘‘windfall’’ payments. Results
may be adjusted up or down based on this review. The Board then determines the performance
bonus payment for each of our Senior Officers, which cannot exceed the individual maximum
bonus determined at the start of the fiscal year.
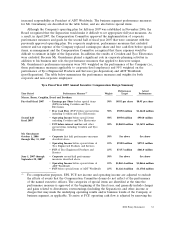
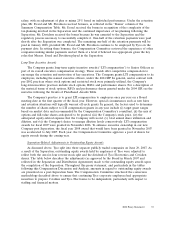
Fiscal 2007 was a unique year for the Company, as the Separation made the annual incentive
compensation process particularly complex. Performance measures and targets for the Company and for
each group, division and business unit were set in November 2006 for the first half of fiscal year 2007.
For corporate-level employees (including Messrs. Breen, Coughlin, Evard and Davidson), these
measures consisted of earnings per share and free cash flow before special items for the entire
Company (including the pre-Separation results of the healthcare and electronics segments). For
Mr. Gursahaney, half of his performance bonus was based on corporate level results and half was based
on the results of the business segments he managed during the fiscal year. Mr. Gursahaney led Tyco
Engineered Products and Services for the first two thirds of the fiscal year before taking on the
32 2008 Proxy Statement