ADT 2007 Annual Report Download - page 237
Download and view the complete annual report
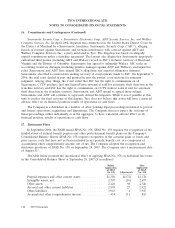
Please find page 237 of the 2007 ADT annual report below. You can navigate through the pages in the report by either clicking on the pages listed below, or by using the keyword search tool below to find specific information within the annual report.-
 1
1 -
2
-
3
-
4
-
5
-
6
-
7
-
8
-
9
-
10
-
11
-
12
-
13
-
14
-
15
-
16
-
17
-
18
-
19
-
20
-
21
-
22
-
23
-
24
-
25
-
26
-
27
-
28
-
29
-
30
-
31
-
32
-
33
-
34
-
35
-
36
-
37
-
38
-
39
-
40
-
41
-
42
-
43
-
44
-
45
-
46
-
47
-
48
-
49
-
50
-
51
-
52
-
53
-
54
-
55
-
56
-
57
-
58
-
59
-
60
-
61
-
62
-
63
-
64
-
65
-
66
-
67
-
68
-
69
-
70
-
71
-
72
-
73
-
74
-
75
-
76
-
77
-
78
-
79
-
80
-
81
-
82
-
83
-
84
-
85
-
86
-
87
-
88
-
89
-
90
-
91
-
92
-
93
-
94
-
95
-
96
-
97
-
98
-
99
-
100
-
101
-
102
-
103
-
104
-
105
-
106
-
107
-
108
-
109
-
110
-
111
-
112
-
113
-
114
-
115
-
116
-
117
-
118
-
119
-
120
-
121
-
122
-
123
-
124
-
125
-
126
-
127
-
128
-
129
-
130
-
131
-
132
-
133
-
134
-
135
-
136
-
137
-
138
-
139
-
140
-
141
-
142
-
143
-
144
-
145
-
146
-
147
-
148
-
149
-
150
-
151
-
152
-
153
-
154
-
155
-
156
-
157
-
158
-
159
-
160
-
161
-
162
-
163
-
164
-
165
-
166
-
167
-
168
-
169
-
170
-
171
-
172
-
173
-
174
-
175
-
176
-
177
-
178
-
179
-
180
-
181
-
182
-
183
-
184
-
185
-
186
-
187
-
188
-
189
-
190
-
191
-
192
-
193
-
194
-
195
-
196
-
197
-
198
-
199
-
200
-
201
-
202
-
203
-
204
-
205
-
206
-
207
-
208
-
209
-
210
-
211
-
212
-
213
-
214
-
215
-
216
-
217
-
218
-
219
-
220
-
221
-
222
-
223
-
224
-
225
-
226
-
 227
227 -
 228
228 -
 229
229 -
 230
230 -
 231
231 -
 232
232 -
 233
233 -
 234
234 -
 235
235 -
 236
236 -
 237
237 -
 238
238 -
 239
239 -
 240
240 -
 241
241 -
 242
242 -
 243
243 -
 244
244 -
 245
245 -
 246
246 -
 247
247 -
248
-
249
-
250
-
251
-
252
-
253
-
254
-
255
-
256
-
257
-
258
-
259
-
260
-
261
-
262
-
263
-
264
-
265
-
266
-
267
-
268
-
269
-
270
-
271
-
272
-
273
-
274
 |
 |

TYCO INTERNATIONAL LTD.
NOTES TO CONSOLIDATED FINANCIAL STATEMENTS
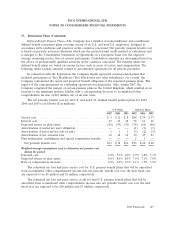
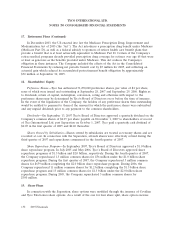
17. Retirement Plans (Continued)
Defined Benefit Pension Plans—The Company has a number of noncontributory and contributory
defined benefit retirement plans covering certain of its U.S. and non-U.S. employees, designed in
accordance with conditions and practices in the countries concerned. Net periodic pension benefit cost
is based on periodic actuarial valuations which use the projected unit credit method of calculation and
is charged to the Consolidated Statements of Operations on a systematic basis over the expected
average remaining service lives of current participants. Contribution amounts are determined based on
the advice of professionally qualified actuaries in the countries concerned. The benefits under the
defined benefit plans are based on various factors, such as years of service and compensation. The
following tables exclude amounts related to discontinued operations for all periods presented.
In connection with the Separation, the Company legally separated certain pension plans that
included participants of Tyco Healthcare, Tyco Electronics and other subsidiaries. As a result, the
Company remeasured the assets and projected benefit obligation of the separated pension plans. The
impact of the remeasurement on continuing operations was immaterial. Also, during 2007, the
Company completed the merger of certain pension plans in the United Kingdom, which resulted in an
increase to the minimum pension liability with a corresponding decrease to accumulated other
comprehensive income of $10 million, net of income taxes.
The net periodic benefit cost for all U.S. and non-U.S. defined benefit pension plans for 2007,
2006 and 2005 is as follows ($ in millions):
U.S. Plans Non-U.S. Plans
2007 2006 2005 2007 2006 2005
Service cost ...................................... $ 9 $11 $ 8 $48 $39 $37
Interest cost ...................................... 47 43 42 74 61 60
Expected return on plan assets ......................... (56) (55) (51) (74) (61) (50)
Amortization of initial net asset obligation ................ — — — (1) (1) (1)
Amortization of prior service cost (credit) ................ 1 1 1 (3) (2) (1)
Amortization of net actuarial loss ....................... 12 18 14 30 25 23
Plan settlements, curtailments and special termination benefits . — — — 2 1 —
Net periodic benefit cost ........................... $13 $18 $14 $76 $62 $68
Weighted-average assumptions used to determine net pension cost
during the period:
Discount rate ..................................... 6.0% 5.3% 6.0% 4.9% 4.8% 5.3%
Expected return on plan assets ......................... 8.0% 8.0% 8.0% 7.0% 7.1% 7.0%
Rate of compensation increase ......................... 4.0% 4.0% 4.3% 4.1% 3.9% 3.9%
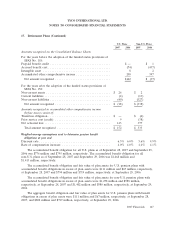
The estimated net loss and prior service cost for U.S. pension benefit plans that will be amortized
from accumulated other comprehensive income into net periodic benefit cost over the next fiscal year
are expected to be $6 million and $1 million, respectively.
The estimated net loss and prior service credit for non-U.S. pension benefit plans that will be
amortized from accumulated other comprehensive income into net periodic benefit cost over the next
fiscal year are expected to be $20 million and $3 million, respectively.
2007 Financials 145