ADT 2007 Annual Report Download - page 191
Download and view the complete annual report
Please find page 191 of the 2007 ADT annual report below. You can navigate through the pages in the report by either clicking on the pages listed below, or by using the keyword search tool below to find specific information within the annual report.-
 1
1 -
2
-
3
-
4
-
5
-
6
-
7
-
8
-
9
-
10
-
11
-
12
-
13
-
14
-
15
-
16
-
17
-
18
-
19
-
20
-
21
-
22
-
23
-
24
-
25
-
26
-
27
-
28
-
29
-
30
-
31
-
32
-
33
-
34
-
35
-
36
-
37
-
38
-
39
-
40
-
41
-
42
-
43
-
44
-
45
-
46
-
47
-
48
-
49
-
50
-
51
-
52
-
53
-
54
-
55
-
56
-
57
-
58
-
59
-
60
-
61
-
62
-
63
-
64
-
65
-
66
-
67
-
68
-
69
-
70
-
71
-
72
-
73
-
74
-
75
-
76
-
77
-
78
-
79
-
80
-
81
-
82
-
83
-
84
-
85
-
86
-
87
-
88
-
89
-
90
-
91
-
92
-
93
-
94
-
95
-
96
-
97
-
98
-
99
-
100
-
101
-
102
-
103
-
104
-
105
-
106
-
107
-
108
-
109
-
110
-
111
-
112
-
113
-
114
-
115
-
116
-
117
-
118
-
119
-
120
-
121
-
122
-
123
-
124
-
125
-
126
-
127
-
128
-
129
-
130
-
131
-
132
-
133
-
134
-
135
-
136
-
137
-
138
-
139
-
140
-
141
-
142
-
143
-
144
-
145
-
146
-
147
-
148
-
149
-
150
-
151
-
152
-
153
-
154
-
155
-
156
-
157
-
158
-
159
-
160
-
161
-
162
-
163
-
164
-
165
-
166
-
167
-
168
-
169
-
170
-
171
-
172
-
173
-
174
-
175
-
176
-
177
-
178
-
179
-
180
-
 181
181 -
 182
182 -
 183
183 -
 184
184 -
 185
185 -
 186
186 -
 187
187 -
 188
188 -
 189
189 -
 190
190 -
 191
191 -
 192
192 -
 193
193 -
 194
194 -
 195
195 -
 196
196 -
 197
197 -
 198
198 -
 199
199 -
 200
200 -
 201
201 -
202
-
203
-
204
-
205
-
206
-
207
-
208
-
209
-
210
-
211
-
212
-
213
-
214
-
215
-
216
-
217
-
218
-
219
-
220
-
221
-
222
-
223
-
224
-
225
-
226
-
227
-
228
-
229
-
230
-
231
-
232
-
233
-
234
-
235
-
236
-
237
-
238
-
239
-
240
-
241
-
242
-
243
-
244
-
245
-
246
-
247
-
248
-
249
-
250
-
251
-
252
-
253
-
254
-
255
-
256
-
257
-
258
-
259
-
260
-
261
-
262
-
263
-
264
-
265
-
266
-
267
-
268
-
269
-
270
-
271
-
272
-
273
-
274
 |
 |

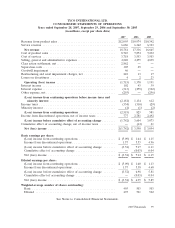
TYCO INTERNATIONAL LTD.
CONSOLIDATED STATEMENTS OF OPERATIONS
Years ended September 28, 2007, September 29, 2006 and September 30, 2005
(in millions, except per share data)
2007 2006 2005
Revenue from product sales ................................. $12,095 $10,974 $10,342
Service revenue .......................................... 6,686 6,362 6,323
Net revenue ........................................... 18,781 17,336 16,665
Cost of product sales ...................................... 8,723 7,874 7,232
Cost of services .......................................... 3,718 3,553 3,503
Selling, general and administrative expenses ...................... 4,828 4,475 4,699
Class action settlement, net .................................. 2,862 — —
Separation costs .......................................... 105 49 —
Goodwill impairment ...................................... 46 — —
Restructuring and asset impairment charges, net .................. 210 13 17
Losses on divestitures ...................................... 4 2 23
Operating (loss) income .................................. (1,715) 1,370 1,191
Interest income .......................................... 102 43 39
Interest expense .......................................... (313) (279) (322)
Other expense, net ........................................ (255) — (296)
(Loss) income from continuing operations before income taxes and
minority interest ...................................... (2,181) 1,134 612
Income taxes ............................................ (334) (310) (29)
Minority interest ......................................... (4) (1) (2)
(Loss) income from continuing operations ..................... (2,519) 823 581
Income from discontinued operations, net of income taxes ........... 777 2,781 2,492
(Loss) income before cumulative effect of accounting change ........ (1,742) 3,604 3,073
Cumulative effect of accounting change, net of income taxes ......... — (14) 21
Net (loss) income ....................................... $(1,742) $ 3,590 $ 3,094
Basic earnings per share:
(Loss) income from continuing operations ..................... $ (5.09) $ 1.64 $ 1.15
Income from discontinued operations ......................... 1.57 5.53 4.96
(Loss) income before cumulative effect of accounting change ....... (3.52) 7.17 6.11
Cumulative effect of accounting change ....................... — (0.03) 0.04
Net (loss) income ....................................... $ (3.52) $ 7.14 $ 6.15
Diluted earnings per share:
(Loss) income from continuing operations ..................... $ (5.09) $ 1.60 $ 1.13
Income from discontinued operations ......................... 1.57 5.38 4.68
(Loss) income before cumulative effect of accounting change ....... (3.52) 6.98 5.81
Cumulative effect of accounting change ....................... — (0.03) 0.04
Net (loss) income ....................................... $ (3.52) $ 6.95 $ 5.85
Weighted-average number of shares outstanding:
Basic ................................................ 495 503 503
Diluted .............................................. 495 521 542
See Notes to Consolidated Financial Statements.
2007 Financials 99