ADT 2007 Annual Report Download - page 150
Download and view the complete annual report
Please find page 150 of the 2007 ADT annual report below. You can navigate through the pages in the report by either clicking on the pages listed below, or by using the keyword search tool below to find specific information within the annual report.-
 1
1 -
2
-
3
-
4
-
5
-
6
-
7
-
8
-
9
-
10
-
11
-
12
-
13
-
14
-
15
-
16
-
17
-
18
-
19
-
20
-
21
-
22
-
23
-
24
-
25
-
26
-
27
-
28
-
29
-
30
-
31
-
32
-
33
-
34
-
35
-
36
-
37
-
38
-
39
-
40
-
41
-
42
-
43
-
44
-
45
-
46
-
47
-
48
-
49
-
50
-
51
-
52
-
53
-
54
-
55
-
56
-
57
-
58
-
59
-
60
-
61
-
62
-
63
-
64
-
65
-
66
-
67
-
68
-
69
-
70
-
71
-
72
-
73
-
74
-
75
-
76
-
77
-
78
-
79
-
80
-
81
-
82
-
83
-
84
-
85
-
86
-
87
-
88
-
89
-
90
-
91
-
92
-
93
-
94
-
95
-
96
-
97
-
98
-
99
-
100
-
101
-
102
-
103
-
104
-
105
-
106
-
107
-
108
-
109
-
110
-
111
-
112
-
113
-
114
-
115
-
116
-
117
-
118
-
119
-
120
-
121
-
122
-
123
-
124
-
125
-
126
-
127
-
128
-
129
-
130
-
131
-
132
-
133
-
134
-
135
-
136
-
137
-
138
-
139
-
 140
140 -
 141
141 -
 142
142 -
 143
143 -
 144
144 -
 145
145 -
 146
146 -
 147
147 -
 148
148 -
 149
149 -
 150
150 -
 151
151 -
 152
152 -
 153
153 -
 154
154 -
 155
155 -
 156
156 -
 157
157 -
 158
158 -
 159
159 -
 160
160 -
161
-
162
-
163
-
164
-
165
-
166
-
167
-
168
-
169
-
170
-
171
-
172
-
173
-
174
-
175
-
176
-
177
-
178
-
179
-
180
-
181
-
182
-
183
-
184
-
185
-
186
-
187
-
188
-
189
-
190
-
191
-
192
-
193
-
194
-
195
-
196
-
197
-
198
-
199
-
200
-
201
-
202
-
203
-
204
-
205
-
206
-
207
-
208
-
209
-
210
-
211
-
212
-
213
-
214
-
215
-
216
-
217
-
218
-
219
-
220
-
221
-
222
-
223
-
224
-
225
-
226
-
227
-
228
-
229
-
230
-
231
-
232
-
233
-
234
-
235
-
236
-
237
-
238
-
239
-
240
-
241
-
242
-
243
-
244
-
245
-
246
-
247
-
248
-
249
-
250
-
251
-
252
-
253
-
254
-
255
-
256
-
257
-
258
-
259
-
260
-
261
-
262
-
263
-
264
-
265
-
266
-
267
-
268
-
269
-
270
-
271
-
272
-
273
-
274
 |
 |

conditions in the United States, Middle East and China and new product introductions, including clean
agent fire suppression systems. The electronic security business also experienced favorable growth as a
result of new product introductions and new market expansions. Foreign currency exchange rates
negatively impacted revenues by $7 million.
Operating income decreased $76 million in 2006 over 2005 primarily as a result of a $100 million
charge related to a pre-existing voluntary replacement program for sprinkler heads in the fire
suppression business. This charge reflected our updated estimate of the additional costs necessary to
bring the program to completion. The decrease in operating income during 2006 was partially offset by
volume growth and higher margins from new product introductions and price increases in the fire
suppression and electronic security business, as well as cost reduction benefits from the 2004
restructuring programs. Also, 2006 results include the effect of incremental stock option charges
required under SFAS No. 123R of $5 million.
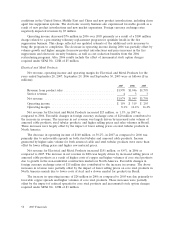
Electrical and Metal Products
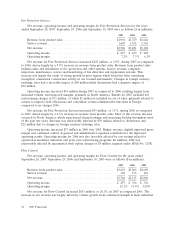
Net revenue, operating income and operating margin for Electrical and Metal Products for the
years ended September 28, 2007, September 29, 2006 and September 30, 2005 were as follows ($ in
millions):
2007 2006 2005
Revenue from product sales ............................. $1,970 $1,946 $1,795
Service revenue ......................................433
Net revenue ........................................ $1,974 $1,949 $1,798
Operating income .................................... $ 159 $ 319 $ 295
Operating margin ..................................... 8.1% 16.4% 16.4%
Net revenue for Electrical and Metal Products increased $25 million, or 1.3%, in 2007 as
compared to 2006. Favorable changes in foreign currency exchange rates of $20 million contributed to
the increase in revenue. The increase in net revenue was largely driven by increased sales volume of
armored cable products, steel tubular products, and higher selling prices and sales volumes in Brazil.
These increases were largely offset by the impact of lower selling prices on steel tubular products in
North America.
The decrease in operating income of $160 million, or 50.2%, in 2007 as compared to 2006 was
primarily due to unfavorable spreads on both steel tubular and armored cable products. Income
generated by higher sales volume for both armored cable and steel tubular products were more than
offset by lower selling prices and higher raw material prices.
Net revenue for Electrical and Metal Products increased $151 million, or 8.4%, in 2006 as
compared to 2005. The increase in net revenue in 2006 was largely driven by increased selling prices of
armored cable products as a result of higher costs of copper and higher volumes of core steel products
due to growth in the non-residential construction markets in North America. Favorable changes in
foreign currency exchange rates of $15 million also contributed to the increase in revenue. The above
increases in revenue were partially offset by the impact of lower selling prices on core steel products in
North America mainly due to lower costs of steel and a slower market for products in Brazil.
The increase in operating income of $24 million in 2006 as compared to 2005 was due primarily to
favorable copper spreads and higher volumes of core steel products. These increases were partially
offset by the impact of reduced spreads for core steel products and incremental stock option charges
required under SFAS No. 123R of $3 million.
58 2007 Financials