ADT 2007 Annual Report Download - page 151
Download and view the complete annual report
Please find page 151 of the 2007 ADT annual report below. You can navigate through the pages in the report by either clicking on the pages listed below, or by using the keyword search tool below to find specific information within the annual report.-
 1
1 -
2
-
3
-
4
-
5
-
6
-
7
-
8
-
9
-
10
-
11
-
12
-
13
-
14
-
15
-
16
-
17
-
18
-
19
-
20
-
21
-
22
-
23
-
24
-
25
-
26
-
27
-
28
-
29
-
30
-
31
-
32
-
33
-
34
-
35
-
36
-
37
-
38
-
39
-
40
-
41
-
42
-
43
-
44
-
45
-
46
-
47
-
48
-
49
-
50
-
51
-
52
-
53
-
54
-
55
-
56
-
57
-
58
-
59
-
60
-
61
-
62
-
63
-
64
-
65
-
66
-
67
-
68
-
69
-
70
-
71
-
72
-
73
-
74
-
75
-
76
-
77
-
78
-
79
-
80
-
81
-
82
-
83
-
84
-
85
-
86
-
87
-
88
-
89
-
90
-
91
-
92
-
93
-
94
-
95
-
96
-
97
-
98
-
99
-
100
-
101
-
102
-
103
-
104
-
105
-
106
-
107
-
108
-
109
-
110
-
111
-
112
-
113
-
114
-
115
-
116
-
117
-
118
-
119
-
120
-
121
-
122
-
123
-
124
-
125
-
126
-
127
-
128
-
129
-
130
-
131
-
132
-
133
-
134
-
135
-
136
-
137
-
138
-
139
-
140
-
 141
141 -
 142
142 -
 143
143 -
 144
144 -
 145
145 -
 146
146 -
 147
147 -
 148
148 -
 149
149 -
 150
150 -
 151
151 -
 152
152 -
 153
153 -
 154
154 -
 155
155 -
 156
156 -
 157
157 -
 158
158 -
 159
159 -
 160
160 -
 161
161 -
162
-
163
-
164
-
165
-
166
-
167
-
168
-
169
-
170
-
171
-
172
-
173
-
174
-
175
-
176
-
177
-
178
-
179
-
180
-
181
-
182
-
183
-
184
-
185
-
186
-
187
-
188
-
189
-
190
-
191
-
192
-
193
-
194
-
195
-
196
-
197
-
198
-
199
-
200
-
201
-
202
-
203
-
204
-
205
-
206
-
207
-
208
-
209
-
210
-
211
-
212
-
213
-
214
-
215
-
216
-
217
-
218
-
219
-
220
-
221
-
222
-
223
-
224
-
225
-
226
-
227
-
228
-
229
-
230
-
231
-
232
-
233
-
234
-
235
-
236
-
237
-
238
-
239
-
240
-
241
-
242
-
243
-
244
-
245
-
246
-
247
-
248
-
249
-
250
-
251
-
252
-
253
-
254
-
255
-
256
-
257
-
258
-
259
-
260
-
261
-
262
-
263
-
264
-
265
-
266
-
267
-
268
-
269
-
270
-
271
-
272
-
273
-
274
 |
 |

Corporate and Other
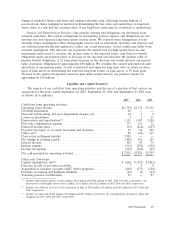
Net revenue, operating income and operating margin for Corporate and Other Metal Products for
the years ended September 28, 2007, September 29, 2006 and September 30, 2005 were as follows ($ in
millions):
2007 2006 2005
Revenue from product sales .............................. $ 120 $ 91 $ 93
Service revenue ....................................... — — —
Net revenue ......................................... $ 120 $ 91 $ 93
Operations .......................................... $ 24 $ 18 $ 18
Corporate expense .................................... (3,736) (671) (890)
Operating loss ....................................... $(3,712) $(653) $(872)
Corporate and Other includes the operating results of certain international buildings products
businesses.
Corporate expense for 2007 included class action settlement charge, net of $2.862 billion,
Separation related costs of $104 million, and net restructuring charges of $40 million primarily related
to the consolidation of certain headquarter functions. Additionally, corporate expense for 2007 includes
$13 million of charges related to the accelerated amortization of restricted shares in connection with
the Separation.
In connection with the Separation, we have initiated actions to reduce our corporate expense and
are targeting a full year corporate expense run rate of $500 million by mid-2008.
Corporate expense in 2006 was $219 million lower than 2005. Corporate expense for 2006 included
$72 million of income related to the extinguishment of certain payment obligations under a split dollar
life insurance policy and rabbi trust pursuant to a settlement with Mr. Kozlowski, former Chief
Executive Officer, and $48 million of income resulting from a reduction in our estimated workers’
compensation liabilities primarily due to favorable claims experience. These income items were partially
offset by incremental stock option charges of $47 million required under SFAS 123R, Separation
related costs of $49 million and restructuring and divestiture charges of $2 million. On a comparative
basis to 2005, corporate expense in 2006 also benefited from lower Sarbanes-Oxley compliance costs.
Corporate expense for 2005 included a $50 million charge for fines and penalties paid to resolve
the matters raised in the SEC investigation that commenced in June 2002, as well as a $70 million
charge for estimated contingencies related to contested legal proceedings seeking to enforce retention
agreements for five former executives.
Interest Income and Expense
Interest income was $102 million in 2007, as compared to $43 million and $39 million in 2006 and
2005, respectively. The increase in interest income in 2007 is primarily related to interest earned on the
class action settlement escrow of $41 million.
Interest expense was $313 million in 2007, as compared to $279 million in 2006 and $322 million in
2005. The increase in interest expense in 2007 is a result of interest on the class action settlement
liability of $41 million, partially offset by lower debt outstanding. The decrease in interest expense in
2006 is primarily driven by lower debt balances, partially offset by the impact of higher interest rates on
our interest rate swap program as compared to 2005.
The weighted-average interest rate on total debt outstanding at September 28, 2007, September 29,
2006 and September 30, 2005 were 6.3%, 6.0% and 5.7%, respectively.
2007 Financials 59