ADT 2007 Annual Report Download - page 4
Download and view the complete annual report
Please find page 4 of the 2007 ADT annual report below. You can navigate through the pages in the report by either clicking on the pages listed below, or by using the keyword search tool below to find specific information within the annual report.-
 1
1 -
 2
2 -
 3
3 -
 4
4 -
 5
5 -
 6
6 -
 7
7 -
 8
8 -
 9
9 -
 10
10 -
 11
11 -
 12
12 -
 13
13 -
 14
14 -
 15
15 -
16
-
17
-
18
-
19
-
20
-
21
-
22
-
23
-
24
-
25
-
26
-
27
-
28
-
29
-
30
-
31
-
32
-
33
-
34
-
35
-
36
-
37
-
38
-
39
-
40
-
41
-
42
-
43
-
44
-
45
-
46
-
47
-
48
-
49
-
50
-
51
-
52
-
53
-
54
-
55
-
56
-
57
-
58
-
59
-
60
-
61
-
62
-
63
-
64
-
65
-
66
-
67
-
68
-
69
-
70
-
71
-
72
-
73
-
74
-
75
-
76
-
77
-
78
-
79
-
80
-
81
-
82
-
83
-
84
-
85
-
86
-
87
-
88
-
89
-
90
-
91
-
92
-
93
-
94
-
95
-
96
-
97
-
98
-
99
-
100
-
101
-
102
-
103
-
104
-
105
-
106
-
107
-
108
-
109
-
110
-
111
-
112
-
113
-
114
-
115
-
116
-
117
-
118
-
119
-
120
-
121
-
122
-
123
-
124
-
125
-
126
-
127
-
128
-
129
-
130
-
131
-
132
-
133
-
134
-
135
-
136
-
137
-
138
-
139
-
140
-
141
-
142
-
143
-
144
-
145
-
146
-
147
-
148
-
149
-
150
-
151
-
152
-
153
-
154
-
155
-
156
-
157
-
158
-
159
-
160
-
161
-
162
-
163
-
164
-
165
-
166
-
167
-
168
-
169
-
170
-
171
-
172
-
173
-
174
-
175
-
176
-
177
-
178
-
179
-
180
-
181
-
182
-
183
-
184
-
185
-
186
-
187
-
188
-
189
-
190
-
191
-
192
-
193
-
194
-
195
-
196
-
197
-
198
-
199
-
200
-
201
-
202
-
203
-
204
-
205
-
206
-
207
-
208
-
209
-
210
-
211
-
212
-
213
-
214
-
215
-
216
-
217
-
218
-
219
-
220
-
221
-
222
-
223
-
224
-
225
-
226
-
227
-
228
-
229
-
230
-
231
-
232
-
233
-
234
-
235
-
236
-
237
-
238
-
239
-
240
-
241
-
242
-
243
-
244
-
245
-
246
-
247
-
248
-
249
-
250
-
251
-
252
-
253
-
254
-
255
-
256
-
257
-
258
-
259
-
260
-
261
-
262
-
263
-
264
-
265
-
266
-
267
-
268
-
269
-
270
-
271
-
272
-
273
-
274
 |
 |

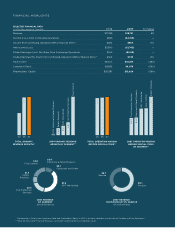
FINANCIAL HIGHLIGHTS
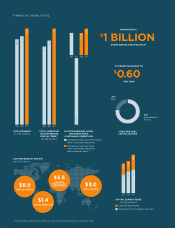
SELECTED FINANCIAL DATA
(in US$ millions except per share data) 2006 2007 % Change
Revenue $17,336 $18,781 8%
Income (Loss) from Continuing Operations $823 ($2,519) —
Income from Continuing Operations Before Special Items** $824 $964 17%
Net Income (Loss) $3,590 ($1,742) —
Diluted Earnings (Loss) Per Share from Continuing Operations $1.60 ($5.09) —
Diluted Earnings Per Share from Continuing Operations Before Special Items** $1.60 $1.93 21%
Total Assets* $63,011 $32,815 (48%)
Long-term Debt* $8,853 $4,076 (54%)
Shareholders’ Equity* $35,387 $15,624 (56%)
* The decrease in Total Assets, Long-term Debt and Shareholders’ Equity in 2007 is primarily related to the spin-offs of Covidien and Tyco Electronics.
** These are Non-GAAP Financial Measures. See GAAP reconciliations on inside back cover.
05 06 07 05 06 07
5.4%
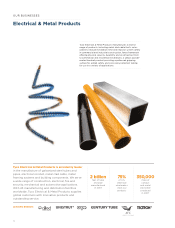
0.2% Electrical & Metal Products
2.6%
2.6%
Safety Products
3.5%
3.5%
ADT Worldwide
4.8%
4.8%
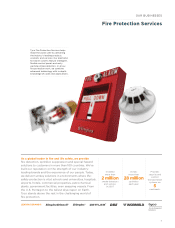
Fire Protection Services
14.4%
14.4%
8.0%
8.0%
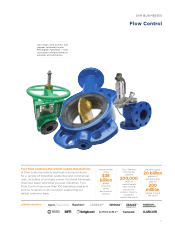
Flow Control
5.3%
5.3%
3.1%
3.1%
8.1%
8.1%
8.3%
8.2%
8.2%
Fire Protection Services
8.4%
8.4%
Electrical & Metal Products
12.7%
12.7%
ADT Worldwide
12.9%
12.9%
Flow Control
18.4%
18.4%
Safety Products
TOTAL ORGANIC
REVENUE GROWTH**
2007 ORGANIC REVENUE
GROWTH BY SEGMENT**
TOTAL OPERATING MARGIN
BEFORE SPECIAL ITEMS**
2007 OPERATING MARGIN
BEFORE SPECIAL ITEMS
BY SEGMENT**
>`]RcQb
%@3D3<C3
4@=;>@=2C1BDAA3@D713
W\CAPWZZW]\a
$%
AS`dWQS
!&
4Z]e1]\b`]Z
%$
/2BE]`ZReWRS
!#
4W`S>`]bSQbW]\
AS`dWQSa
%@3D3<C3
0GA35;3<B
W\CAPWZZW]\a
1]`^]`ObSO\R=bVS`
&
AOTSbg
>`]RcQba
3ZSQb`WQOZ;SbOZ>`]RcQba