ADT 2005 Annual Report Download - page 59
Download and view the complete annual report
Please find page 59 of the 2005 ADT annual report below. You can navigate through the pages in the report by either clicking on the pages listed below, or by using the keyword search tool below to find specific information within the annual report.-
 1
1 -
2
-
3
-
4
-
5
-
6
-
7
-
8
-
9
-
10
-
11
-
12
-
13
-
14
-
15
-
16
-
17
-
18
-
19
-
20
-
21
-
22
-
23
-
24
-
25
-
26
-
27
-
28
-
29
-
30
-
31
-
32
-
33
-
34
-
35
-
36
-
37
-
38
-
39
-
40
-
41
-
42
-
43
-
44
-
45
-
46
-
47
-
48
-
 49
49 -
 50
50 -
 51
51 -
 52
52 -
 53
53 -
 54
54 -
 55
55 -
 56
56 -
 57
57 -
 58
58 -
 59
59 -
 60
60 -
 61
61 -
 62
62 -
 63
63 -
 64
64 -
 65
65 -
 66
66 -
 67
67 -
 68
68 -
 69
69 -
70
-
71
-
72
-
73
-
74
-
75
-
76
-
77
-
78
-
79
-
80
-
81
-
82
-
83
-
84
-
85
-
86
-
87
-
88
-
89
-
90
-
91
-
92
-
93
-
94
-
95
-
96
-
97
-
98
-
99
-
100
-
101
-
102
-
103
-
104
-
105
-
106
-
107
-
108
-
109
-
110
-
111
-
112
-
113
-
114
-
115
-
116
-
117
-
118
-
119
-
120
-
121
-
122
-
123
-
124
-
125
-
126
-
127
-
128
-
129
-
130
-
131
-
132
-
133
-
134
-
135
-
136
-
137
-
138
-
139
-
140
-
141
-
142
-
143
-
144
-
145
-
146
-
147
-
148
-
149
-
150
-
151
-
152
-
153
-
154
-
155
-
156
-
157
-
158
-
159
-
160
-
161
-
162
-
163
-
164
-
165
-
166
-
167
-
168
-
169
-
170
-
171
-
172
-
173
-
174
-
175
-
176
-
177
-
178
-
179
-
180
-
181
-
182
-
183
-
184
-
185
-
186
-
187
-
188
-
189
-
190
-
191
-
192
-
193
-
194
-
195
-
196
-
197
-
198
-
199
-
200
-
201
-
202
-
203
-
204
-
205
-
206
-
207
-
208
-
209
-
210
-
211
-
212
-
213
-
214
-
215
-
216
-
217
-
218
-
219
-
220
-
221
-
222
-
223
-
224
-
225
-
226
-
227
-
228
-
229
-
230
-
231
-
232
 |
 |
subject to achievement of a net income threshold. Annual incentive bonus opportunities for officers in
the corporate headquarters were based on the overall performance of Tyco, using Company Earnings
Per Share (‘‘EPS’’) and total Company free cash flow as the performance measures. Annual incentive
bonus opportunities for segment presidents were based upon the Committee’s assessment of the
respective segment’s financial performance, evaluated using earnings before interest and taxes
(‘‘EBIT’’) and segment free cash flow, with a portion of the annual incentive bonus based on the
overall EPS and performance of Tyco, using total Company EPS and free cash flow, as described
above. In addition, certain businesses elected to incorporate a ‘‘Key Performance Measure,’’ such as
revenue growth, that reflected business needs and objectives of a particular segment or business unit. In
conjunction with the Company’s goal to achieve Company-wide compliance with Section 404 of the
Sarbanes-Oxley Act, during calendar year 2005 we encouraged use of the +/-25% differentiation factor
for employees other than Section 16 Officers to recognize extraordinary efforts aimed at achievement
of this goal.
In addition to the Committee’s critical review of 2005 annual incentive payouts and equity grants,
during 2005 the Committee worked with its independent compensation consultant to conduct an
in-depth review of all officer and senior executive employment agreements (including potential
severance obligations under such agreements) as well as existing change in control arrangements,
severance plans and executive retirement benefit obligations, to assure that such plans and
arrangements were appropriate and competitive. During 2005, an internal audit was conducted of
compensation practices, including appropriate documentation of compensation actions, compliance with
the Company’s Delegation of Authority and other compensation related control processes.
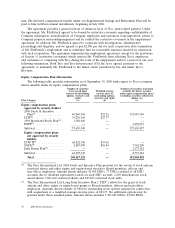
The Summary Compensation table on page 23 reflects the bonus amounts for Messrs. Breen,
FitzPatrick and Lytton, reflecting payments based on the performance of the Company’s 2005 EPS and
free cash flow goals. Mr. Meelia’s bonus reflects payments based 80% on the performance of the
Company’s Healthcare segment and 20% on the performance of Tyco overall during fiscal 2005. The
amount awarded to Dr. Gromer reflects a cash payment based 80% on the performance of the
Company’s Electronics segment and 20% on the performance of Tyco overall during fiscal 2005.
Similarly, the amount awarded to Mr. Lynch reflects a cash payment based 80% on the performance of
the Company’s Engineered Products and Services segment and 20% on the performance of Tyco overall
during fiscal 2005.
Chief Executive Officer Compensation
The Compensation and Human Resources Committee and the Nominating and Governance
Committee jointly reviewed the performance of our Chief Executive Officer using a CEO scorecard
introduced in 2003. The scorecard was developed as a tool to evaluate performance, provide relevant,
thoughtful feedback, and support pay decisions. In addition to Company performance, the scorecard
reviewed elements of personal performance such as leadership, business acumen, selection and
development of people, and adherence to principles of corporate governance.
For fiscal 2005, Mr. Breen received an increase to his annual salary, based on merit, of 4% (2.7%
on an annualized basis). His resulting annualized salary is $1,625,000. Based on performance against
Company EPS and free cash flow goals, Mr. Breen earned a fiscal 2005 Annual Incentive of $1,485,088,
determined based on the Company’s EPS and free cash flow results. In March 2005, the Committee
awarded Mr. Breen 160,000 shares of restricted stock and 600,000 premium-priced stock options. The
restricted stock granted to Mr. Breen vests on the third anniversary of the grant, while the premium-
priced options granted to Mr. Breen vest in equal installments over a three-year period, with exercise
prices per share of $37.00, $41.00 and $45.00, respectively. The average price of Tyco common shares in
fiscal 2005 was $31.80. The Committee feels that the use of premium priced options in 2005 helped to
align Mr. Breen’s long-term compensation with the interests of shareholders and the Company by
establishing fixed exercise prices that build in required threshold increases in shareholder value.
2006 Proxy Statement 41