ADT 2005 Annual Report Download - page 206
Download and view the complete annual report
Please find page 206 of the 2005 ADT annual report below. You can navigate through the pages in the report by either clicking on the pages listed below, or by using the keyword search tool below to find specific information within the annual report.-
 1
1 -
2
-
3
-
4
-
5
-
6
-
7
-
8
-
9
-
10
-
11
-
12
-
13
-
14
-
15
-
16
-
17
-
18
-
19
-
20
-
21
-
22
-
23
-
24
-
25
-
26
-
27
-
28
-
29
-
30
-
31
-
32
-
33
-
34
-
35
-
36
-
37
-
38
-
39
-
40
-
41
-
42
-
43
-
44
-
45
-
46
-
47
-
48
-
49
-
50
-
51
-
52
-
53
-
54
-
55
-
56
-
57
-
58
-
59
-
60
-
61
-
62
-
63
-
64
-
65
-
66
-
67
-
68
-
69
-
70
-
71
-
72
-
73
-
74
-
75
-
76
-
77
-
78
-
79
-
80
-
81
-
82
-
83
-
84
-
85
-
86
-
87
-
88
-
89
-
90
-
91
-
92
-
93
-
94
-
95
-
96
-
97
-
98
-
99
-
100
-
101
-
102
-
103
-
104
-
105
-
106
-
107
-
108
-
109
-
110
-
111
-
112
-
113
-
114
-
115
-
116
-
117
-
118
-
119
-
120
-
121
-
122
-
123
-
124
-
125
-
126
-
127
-
128
-
129
-
130
-
131
-
132
-
133
-
134
-
135
-
136
-
137
-
138
-
139
-
140
-
141
-
142
-
143
-
144
-
145
-
146
-
147
-
148
-
149
-
150
-
151
-
152
-
153
-
154
-
155
-
156
-
157
-
158
-
159
-
160
-
161
-
162
-
163
-
164
-
165
-
166
-
167
-
168
-
169
-
170
-
171
-
172
-
173
-
174
-
175
-
176
-
177
-
178
-
179
-
180
-
181
-
182
-
183
-
184
-
185
-
186
-
187
-
188
-
189
-
190
-
191
-
192
-
193
-
194
-
195
-
 196
196 -
 197
197 -
 198
198 -
 199
199 -
 200
200 -
 201
201 -
 202
202 -
 203
203 -
 204
204 -
 205
205 -
 206
206 -
 207
207 -
 208
208 -
 209
209 -
 210
210 -
 211
211 -
 212
212 -
 213
213 -
 214
214 -
 215
215 -
 216
216 -
217
-
218
-
219
-
220
-
221
-
222
-
223
-
224
-
225
-
226
-
227
-
228
-
229
-
230
-
231
-
232
 |
 |

TYCO INTERNATIONAL LTD.
NOTES TO CONSOLIDATED FINANCIAL STATEMENTS
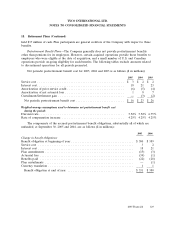
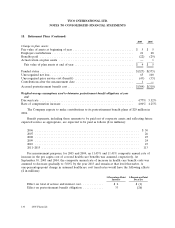
18. Retirement Plans (Continued)
2005 2004
Change in plan assets:
Fair value of assets at beginning of year ................................... $ 5 $ 5
Employer contributions ............................................... 21 28
Benefits paid ...................................................... (22) (29)
Actual return on plan assets ........................................... — 1
Fair value of plan assets at end of year .................................. $ 4 $ 5
Funded status ...................................................... $(327) $(375)
Unrecognized net loss ................................................ 65 100
Unrecognized prior service cost (benefit) .................................. (43) (35)
Contributions after the measurement date ................................. 1 —
Accrued postretirement benefit cost ...................................... $(304) $(310)
Weighted-average assumptions used to determine postretirement benefit obligations at year
end:
Discount rate ...................................................... 4.77% 5.52%
Rate of compensation increase ......................................... 4.00% 4.25%
The Company expects to make contributions to its postretirement benefit plans of $29 million in
2006.
Benefit payments, including those amounts to be paid out of corporate assets and reflecting future
expected service as appropriate, are expected to be paid as follows ($ in millions):
2006 ............................................................ $ 30
2007 ............................................................ 26
2008 ............................................................ 25
2009 ............................................................ 24
2010 ............................................................ 23
2011–2015 ........................................................ 113
For measurement purposes, for 2005 and 2004, an 11.45% and 11.41% composite annual rate of
increase in the per capita cost of covered health care benefits was assumed, respectively. At
September 30, 2005 and 2004, the composite annual rate of increase in health care benefit costs was
assumed to decrease gradually to 5.00% by the year 2013 and remain at that level thereafter. A
one-percentage-point change in assumed healthcare cost trend rates would have the following effects
($ in millions):
1-Percentage-Point 1-Percentage-Point
Increase Decrease
Effect on total of service and interest cost ............. $ 2 $ (1)
Effect on postretirement benefit obligation ............ 33 (26)
130 2005 Financials