ADT 2005 Annual Report Download - page 128
Download and view the complete annual report
Please find page 128 of the 2005 ADT annual report below. You can navigate through the pages in the report by either clicking on the pages listed below, or by using the keyword search tool below to find specific information within the annual report.-
 1
1 -
2
-
3
-
4
-
5
-
6
-
7
-
8
-
9
-
10
-
11
-
12
-
13
-
14
-
15
-
16
-
17
-
18
-
19
-
20
-
21
-
22
-
23
-
24
-
25
-
26
-
27
-
28
-
29
-
30
-
31
-
32
-
33
-
34
-
35
-
36
-
37
-
38
-
39
-
40
-
41
-
42
-
43
-
44
-
45
-
46
-
47
-
48
-
49
-
50
-
51
-
52
-
53
-
54
-
55
-
56
-
57
-
58
-
59
-
60
-
61
-
62
-
63
-
64
-
65
-
66
-
67
-
68
-
69
-
70
-
71
-
72
-
73
-
74
-
75
-
76
-
77
-
78
-
79
-
80
-
81
-
82
-
83
-
84
-
85
-
86
-
87
-
88
-
89
-
90
-
91
-
92
-
93
-
94
-
95
-
96
-
97
-
98
-
99
-
100
-
101
-
102
-
103
-
104
-
105
-
106
-
107
-
108
-
109
-
110
-
111
-
112
-
113
-
114
-
115
-
116
-
117
-
 118
118 -
 119
119 -
 120
120 -
 121
121 -
 122
122 -
 123
123 -
 124
124 -
 125
125 -
 126
126 -
 127
127 -
 128
128 -
 129
129 -
 130
130 -
 131
131 -
 132
132 -
 133
133 -
 134
134 -
 135
135 -
 136
136 -
 137
137 -
 138
138 -
139
-
140
-
141
-
142
-
143
-
144
-
145
-
146
-
147
-
148
-
149
-
150
-
151
-
152
-
153
-
154
-
155
-
156
-
157
-
158
-
159
-
160
-
161
-
162
-
163
-
164
-
165
-
166
-
167
-
168
-
169
-
170
-
171
-
172
-
173
-
174
-
175
-
176
-
177
-
178
-
179
-
180
-
181
-
182
-
183
-
184
-
185
-
186
-
187
-
188
-
189
-
190
-
191
-
192
-
193
-
194
-
195
-
196
-
197
-
198
-
199
-
200
-
201
-
202
-
203
-
204
-
205
-
206
-
207
-
208
-
209
-
210
-
211
-
212
-
213
-
214
-
215
-
216
-
217
-
218
-
219
-
220
-
221
-
222
-
223
-
224
-
225
-
226
-
227
-
228
-
229
-
230
-
231
-
232
 |
 |
Sheets were $148 million, of which $79 million are included in accrued and other current liabilities and
$69 million are included in other liabilities.
At September 30, 2005, the acquisition liabilities on our Consolidated Balance Sheets were
$70 million, of which $24 million is included in accrued and other current liabilities and $46 million is
included in other liabilities.
During 2005, the Company sold various businesses for aggregate net proceeds of $295 million of
which $120 million relates to the TGN business. The purchaser of the TGN also assumed certain
liabilities.
In 2005, Surgical, a division of Tyco’s Healthcare segment, acquired Vivant, a developer of
microwave ablation medical technology. The transaction is valued at approximately $66 million cash,
with up to approximately $35 million additional cash to be paid in the future based on the achievement
of certain milestones. Additionally, in November 2005, Tyco’s Healthcare segment acquired a
controlling interest in Floreane Medical Implants, a manufacturer of surgical mesh products. Both of
these transactions strengthen Healthcare’s surgical product portfolio.
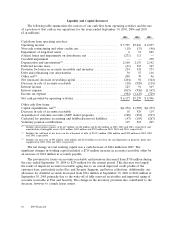
We continue to fund capital expenditures to improve the cost structure of our businesses, to invest
in new processes and technology, and to maintain high quality production standards. Capital spending
increased to $1.3 billion in 2005 from $1.0 billion in 2004. The level of capital expenditures is not
expected to exceed depreciation in 2006 and is expected to increase slightly relative to the level of
spending in 2005.
The amount of income taxes paid, net of refunds, during the year was $790 million.
During the first half of 2006, we expect cash outflows of approximately $500 million for resolution
of certain previously accrued legal and legacy matters including a patent dispute in the Healthcare
segment, an SEC enforcement action and certain holdback liabilities.
Capitalization
Shareholders’ equity was $32.5 billion or $16.10 per share, at September 30, 2005, compared to
$30.3 billion or $15.07 per share, at September 30, 2004. This increase was due primarily to net income
of $3.0 billion and share options exercised of $351 million. These increases were partially offset by
dividends declared of $805 million, the repurchase of shares of $300 million, and an increase in the
minimum pension liability of $200 million, net of income taxes.
At September 30, 2005, total debt decreased $4.0 billion to $12.6 billion, as compared to
$16.6 billion at September 30, 2004. Total debt as a percentage of total capitalization (total debt and
shareholders’ equity) was 28% at September 30, 2005 and 35% at September 30, 2004. The decrease in
debt resulted principally from our repurchase of convertible debentures as discussed below
($2.0 billion) and scheduled repayments of debentures ($1.8 billion). Our cash balance decreased to
$3.2 billion at September 30, 2005, as compared to $4.5 billion at September 30, 2004. The decrease in
cash was primarily due to the convertible debt repurchases and scheduled debt repayments referred to
above. Capital expenditures, and to a lesser extent, dividend payments and acquisition of customer
accounts, also contributed to the cash decrease. Furthermore, the Company used $300 million of cash
to repurchase shares in the open market in connection with the $1.5 billion share repurchase program
approved by the Board of Directors in July 2005. These decreases were partially offset by cash flows
from operations.
On December 16, 2004, Tyco International Group S.A., a wholly-owned subsidiary of the Company
organized under the laws of Luxembourg (‘‘TIGSA’’), entered into a $1.0 billion 5-year revolving credit
facility expiring on December 16, 2009. This facility replaced TIGSA’s $1.0 billion 364-day revolving
credit facility, which was terminated prior to its scheduled expiration date of December 20, 2004. There
52 2005 Financials