ADT 2005 Annual Report Download - page 138
Download and view the complete annual report
Please find page 138 of the 2005 ADT annual report below. You can navigate through the pages in the report by either clicking on the pages listed below, or by using the keyword search tool below to find specific information within the annual report.
Item 7A. Quantitative and Qualitative Disclosures About Market Risk
We are subject to market risk associated with changes in interest rates and foreign currency
exchange rates. In order to manage the volatility relating to our more significant market risks, we enter
into forward foreign currency exchange contracts, cross-currency swaps, foreign currency options, and
interest rate swaps. We do not anticipate any material changes in our primary market risk exposures in
2006.
We utilize established risk management policies and procedures in executing derivative financial
instrument transactions. We do not execute transactions or hold derivative financial instruments for
trading or speculative purposes. Derivative financial instruments related to interest rate sensitivity of
debt obligations, intercompany cross-border transactions and anticipated non-functional currency cash
flows, are used with the goal of mitigating a significant portion of these exposures when it is cost
effective to do so. Counterparties to derivative financial instruments are limited to financial institutions
with at least an A/A2 long-term debt rating.
Interest Rate Sensitivity
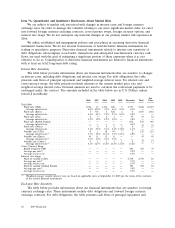
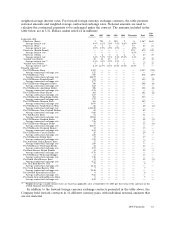
The table below provides information about our financial instruments that are sensitive to changes
in interest rates, including debt obligations and interest rate swaps. For debt obligations, the table
presents cash flows of principal repayment and weighted-average interest rates. For interest rate and
cross-currency swaps, the table presents notional amounts at the current market price rate and
weighted average interest rates. Notional amounts are used to calculate the contractual payments to be
exchanged under the contract. The amounts included in the table below are in U.S. Dollars, unless
noted ($ in millions):
Fair
2006 2007 2008 2009 2010 Thereafter Total Value
Total debt:
Fixed rate (US$) .......................... 1,914 13 1,351 800 5 5,757 9,840 10,637
Average interest rate ...................... 6.0% 10.5% 3.1% 6.1% 6.3% 6.1% — —
Fixed rate (Euro) ......................... 5 725 2 825 2 8 1,567 1,641
Average interest rate ...................... 4.4% 6.1% 7.6% 5.5% 8.5% 6.9% — —
Fixed rate (Yen) .......................... 4 3 2 1 — 53 63 63
Average interest rate ...................... 1.9% 1.9% 1.9% 1.9% — 5.0% — —
Fixed rate (British Pound) .................... — — — — — 872 872 945
Average interest rate ...................... — — — — — 6.5% — —
Fixed rate (Other) ......................... 7 6 4 2 2 6 27 27
Average interest rate ...................... 5.4% 5.5% 5.1% 5.1% 17.8% 1.1% — —
Variable rate (US$) ........................ 9 1 10 94 7 2 123 123
Average interest rate(1) ..................... 3.7% 5.8% 13.3% 7.7% 12.1% 6.9% — —
Variable rate (Euro) ........................ 10 11 13 11 — — 45 45
Average interest rate(1) ..................... 3.4% 3.4% 3.5% 3.5% — — — —
Variable rate (Other) ....................... 5 1 1 1 1 8 17 17
Average interest rate(1) ..................... 6.1% 12.7% 13.2% 13.2% 13.2% 13.2% — —
Cross Currency Swap:
British Pound to USD ...................... — — — — — 350 350 70
Average pay rate(1) ......................... — — — — — 5.9% — —
Average receive rate ....................... — — — — — 6.5% — —
Interest rate swaps:
Fixed to variable (US$) ...................... — — — — — 2,750 2,750 10
Average pay rate(1) ......................... — — — — — 5.7% — —
Average receive rate ....................... — — — — — 6.3% — —
Fixed to variable (British Pound) ................ — — — — — 350 350 10
Average pay rate(1) ......................... — — — — — 5.9% — —
Average receive rate ....................... — — — — — 6.5% — —
(1) Weighted-average variable interest rates are based on applicable rates at September 30, 2005 per the terms of the contracts
of the related financial instruments.
Exchange Rate Sensitivity
The table below provides information about our financial instruments that are sensitive to foreign
currency exchange rates. These instruments include debt obligations and forward foreign currency
exchange contracts. For debt obligations, the table presents cash flows of principal repayment and
62 2005 Financials


