ADT 2005 Annual Report Download - page 111
Download and view the complete annual report
Please find page 111 of the 2005 ADT annual report below. You can navigate through the pages in the report by either clicking on the pages listed below, or by using the keyword search tool below to find specific information within the annual report.-
 1
1 -
2
-
3
-
4
-
5
-
6
-
7
-
8
-
9
-
10
-
11
-
12
-
13
-
14
-
15
-
16
-
17
-
18
-
19
-
20
-
21
-
22
-
23
-
24
-
25
-
26
-
27
-
28
-
29
-
30
-
31
-
32
-
33
-
34
-
35
-
36
-
37
-
38
-
39
-
40
-
41
-
42
-
43
-
44
-
45
-
46
-
47
-
48
-
49
-
50
-
51
-
52
-
53
-
54
-
55
-
56
-
57
-
58
-
59
-
60
-
61
-
62
-
63
-
64
-
65
-
66
-
67
-
68
-
69
-
70
-
71
-
72
-
73
-
74
-
75
-
76
-
77
-
78
-
79
-
80
-
81
-
82
-
83
-
84
-
85
-
86
-
87
-
88
-
89
-
90
-
91
-
92
-
93
-
94
-
95
-
96
-
97
-
98
-
99
-
100
-
 101
101 -
 102
102 -
 103
103 -
 104
104 -
 105
105 -
 106
106 -
 107
107 -
 108
108 -
 109
109 -
 110
110 -
 111
111 -
 112
112 -
 113
113 -
 114
114 -
 115
115 -
 116
116 -
 117
117 -
 118
118 -
 119
119 -
 120
120 -
 121
121 -
122
-
123
-
124
-
125
-
126
-
127
-
128
-
129
-
130
-
131
-
132
-
133
-
134
-
135
-
136
-
137
-
138
-
139
-
140
-
141
-
142
-
143
-
144
-
145
-
146
-
147
-
148
-
149
-
150
-
151
-
152
-
153
-
154
-
155
-
156
-
157
-
158
-
159
-
160
-
161
-
162
-
163
-
164
-
165
-
166
-
167
-
168
-
169
-
170
-
171
-
172
-
173
-
174
-
175
-
176
-
177
-
178
-
179
-
180
-
181
-
182
-
183
-
184
-
185
-
186
-
187
-
188
-
189
-
190
-
191
-
192
-
193
-
194
-
195
-
196
-
197
-
198
-
199
-
200
-
201
-
202
-
203
-
204
-
205
-
206
-
207
-
208
-
209
-
210
-
211
-
212
-
213
-
214
-
215
-
216
-
217
-
218
-
219
-
220
-
221
-
222
-
223
-
224
-
225
-
226
-
227
-
228
-
229
-
230
-
231
-
232
 |
 |

program. As of September 30, 2005, we have repurchased 10.5 million of our common shares for
$300 million. In the two weeks following the end of the fourth quarter of 2005, we have repurchased an
additional 7.9 million of our common shares for $216 million. As a result of this program, we anticipate
spending a total of approximately $2 billion through the second quarter of 2006 for these repurchases.
During the first quarter of 2005, we announced a substantial increase in our quarterly dividend
from $0.0125 per share to $0.10 per share. As a result, dividend payments for 2005 increased to
$628 million from $100 million in the comparable prior year period.
References to Tyco are to the Company’s continuing operations. Prior year amounts have been
reclassified to exclude the results of discontinued operations and to comparatively reflect changes in the
Company’s segment reporting. The operating results of the TGN are presented within Corporate and
Other through the date of its disposal in the third quarter of 2005. Information for 2003 has been
reclassified to reflect the transfer of Tyco’s Precision Interconnect business from Healthcare to
Electronics in 2004.
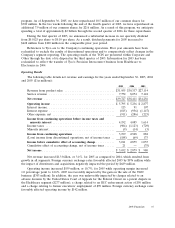
Operating Results
The following table details net revenue and earnings for the years ended September 30, 2005, 2004
and 2003 ($ in millions):
2005 2004 2003
Revenue from product sales ............................. $31,955 $30,337 $27,114
Service revenue ...................................... 7,772 8,074 7,142
Net revenue ......................................... $39,727 $38,411 $34,256
Operating income ..................................... $ 5,795 $ 5,236 $ 2,877
Interest income ....................................... 123 91 107
Interest expense ...................................... (815) (956) (1,147)
Other expense, net .................................... (911) (286) (223)
Income from continuing operations before income taxes and
minority interest .................................... 4,192 4,085 1,614
Income taxes ........................................ (984) (1,123) (729)
Minority interest ...................................... (9) (14) (3)
Income from continuing operations ........................ 3,199 2,948 882
(Loss) income from discontinued operations, net of income taxes . . (188) (69) 173
Income before cumulative effect of accounting change ........... 3,011 2,879 1,055
Cumulative effect of accounting change, net of income taxes ...... 21 — (75)
Net income .......................................... $ 3,032 $ 2,879 $ 980
Net revenue increased $1.3 billion, or 3.4%, for 2005 as compared to 2004, which resulted from
growth in all segments. Foreign currency exchange rates favorably affected 2005 by $876 million while
the impact of divestitures and acquisitions negatively impacted the period by $689 million.
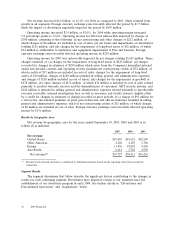
Operating income increased $559 million, or 10.7%, for 2005 while operating margin increased
1.0 percentage point to 14.6%. 2005 was favorably impacted by the gain on the sale of the TGN
business ($303 million). In addition, the year was unfavorably impacted by charges related to an
adverse decision by the United States Court of Appeals for the Federal Circuit on a patent dispute in
the Healthcare segment ($277 million), a charge related to an SEC enforcement action of $50 million
and a charge relating to former executives’ employment of $70 million. Foreign currency exchange rates
favorably affected operating income by $142 million.
2005 Financials 35