ADT 2005 Annual Report Download - page 114
Download and view the complete annual report
Please find page 114 of the 2005 ADT annual report below. You can navigate through the pages in the report by either clicking on the pages listed below, or by using the keyword search tool below to find specific information within the annual report.-
 1
1 -
2
-
3
-
4
-
5
-
6
-
7
-
8
-
9
-
10
-
11
-
12
-
13
-
14
-
15
-
16
-
17
-
18
-
19
-
20
-
21
-
22
-
23
-
24
-
25
-
26
-
27
-
28
-
29
-
30
-
31
-
32
-
33
-
34
-
35
-
36
-
37
-
38
-
39
-
40
-
41
-
42
-
43
-
44
-
45
-
46
-
47
-
48
-
49
-
50
-
51
-
52
-
53
-
54
-
55
-
56
-
57
-
58
-
59
-
60
-
61
-
62
-
63
-
64
-
65
-
66
-
67
-
68
-
69
-
70
-
71
-
72
-
73
-
74
-
75
-
76
-
77
-
78
-
79
-
80
-
81
-
82
-
83
-
84
-
85
-
86
-
87
-
88
-
89
-
90
-
91
-
92
-
93
-
94
-
95
-
96
-
97
-
98
-
99
-
100
-
101
-
102
-
103
-
 104
104 -
 105
105 -
 106
106 -
 107
107 -
 108
108 -
 109
109 -
 110
110 -
 111
111 -
 112
112 -
 113
113 -
 114
114 -
 115
115 -
 116
116 -
 117
117 -
 118
118 -
 119
119 -
 120
120 -
 121
121 -
 122
122 -
 123
123 -
 124
124 -
125
-
126
-
127
-
128
-
129
-
130
-
131
-
132
-
133
-
134
-
135
-
136
-
137
-
138
-
139
-
140
-
141
-
142
-
143
-
144
-
145
-
146
-
147
-
148
-
149
-
150
-
151
-
152
-
153
-
154
-
155
-
156
-
157
-
158
-
159
-
160
-
161
-
162
-
163
-
164
-
165
-
166
-
167
-
168
-
169
-
170
-
171
-
172
-
173
-
174
-
175
-
176
-
177
-
178
-
179
-
180
-
181
-
182
-
183
-
184
-
185
-
186
-
187
-
188
-
189
-
190
-
191
-
192
-
193
-
194
-
195
-
196
-
197
-
198
-
199
-
200
-
201
-
202
-
203
-
204
-
205
-
206
-
207
-
208
-
209
-
210
-
211
-
212
-
213
-
214
-
215
-
216
-
217
-
218
-
219
-
220
-
221
-
222
-
223
-
224
-
225
-
226
-
227
-
228
-
229
-
230
-
231
-
232
 |
 |

adjustments to liabilities such as workers’ compensation, professional fees, and environmental exposure,
a charge of $98 million primarily due to adjusting allowances for doubtful accounts and slow and
non-moving inventory, as well as a write-off of subscriber systems, charges of $34 million for other
adjustments primarily related to deferred commissions, and charges of $6 million related to reconciling
items) recorded in connection with the Company’s intensified internal audits, detailed controls and
operating reviews performed during the year. Also included within the $512 million are impairment
charges of $143 million primarily related to the impairment of intangible assets associated with the
ADT dealer program mostly as a result of increased attrition rates, and to the impairment of property,
plant and equipment of subscriber systems and other fixed assets; net restructuring and other charges
of $10 million, of which charges of $4 million are included in cost of sales and $3 million is for the
write-off of non-current assets, related to streamlining the business; and other charges of $93 million, of
which $34 million is included in cost of sales and $59 million is included in selling, general and
administrative expenses, primarily related to uncollectible receivables, product warranty and the
dismantlement of customers’ ADT security systems. Included within the $143 million impairment
charge and the $10 million net restructuring charge is a charge of $10 million and a credit of
$2 million, respectively, also related to changes in estimates recorded during the quarter ended
March 31, 2003.
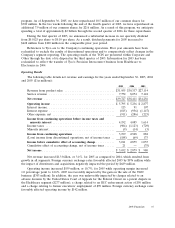
Electronics
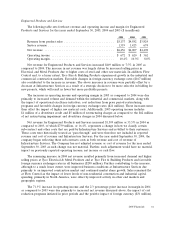
The following table sets forth net revenue and operating income and margin for Electronics for the
years ended September 30, 2005, 2004 and 2003 ($ in millions):
2005 2004 2003
Revenue from product sales .................... $12,042 $11,372 $10,052
Service revenue ............................. 154 450 440
Net revenue ............................... $12,196 $11,822 $10,492
Operating income ........................... $ 1,852 $ 1,749 $ 1,241
Operating margin ........................... 15.2% 14.8% 11.8%
Net revenue for Electronics increased $374 million or 3.2% in 2005 as compared to 2004, including
a 5.9% increase in product revenue. The increase in net revenue was driven primarily by sales to the
automotive, aerospace and defense, consumer electronics, power utilities, communications equipment
manufacturing, and communication service markets. In addition, revenue increased substantially due to
favorable changes in foreign currency exchange rates ($294 million). These increases were partially
offset by the impact of the divestiture of the Electrical Contracting Services business ($353 million).
Operating income and operating margin for 2005 increased as compared to 2004 due primarily to
increased sales volume, cost savings initiatives and favorable changes in foreign currency exchange rates
($57 million). These increases were partially offset by an 80 basis point impact of increased commodity
costs. Additionally, operating income for 2005 included net restructuring and other credits of
$5 million, as compared to net restructuring, divestiture and impairment charges of $22 million in 2004,
discussed below.
Net revenue for Electronics increased 12.7% in 2004 as compared to 2003, including a 13.1%
increase in product revenue and a 2.3% increase in service revenue. The increase in net revenue was
primarily a result of growth in existing businesses, specifically, the automotive, computer, consumer
electronics, communications and industrial and commercial markets. This growth was partially offset by
a decrease in sales of Power Systems products in North America and in our Electrical Contracting
Services, which was divested in September 2004. Additionally, favorable changes in foreign currency
rates ($560 million) contributed to the increase in net revenue.
38 2005 Financials