ADT 2005 Annual Report Download - page 126
Download and view the complete annual report
Please find page 126 of the 2005 ADT annual report below. You can navigate through the pages in the report by either clicking on the pages listed below, or by using the keyword search tool below to find specific information within the annual report.-
 1
1 -
2
-
3
-
4
-
5
-
6
-
7
-
8
-
9
-
10
-
11
-
12
-
13
-
14
-
15
-
16
-
17
-
18
-
19
-
20
-
21
-
22
-
23
-
24
-
25
-
26
-
27
-
28
-
29
-
30
-
31
-
32
-
33
-
34
-
35
-
36
-
37
-
38
-
39
-
40
-
41
-
42
-
43
-
44
-
45
-
46
-
47
-
48
-
49
-
50
-
51
-
52
-
53
-
54
-
55
-
56
-
57
-
58
-
59
-
60
-
61
-
62
-
63
-
64
-
65
-
66
-
67
-
68
-
69
-
70
-
71
-
72
-
73
-
74
-
75
-
76
-
77
-
78
-
79
-
80
-
81
-
82
-
83
-
84
-
85
-
86
-
87
-
88
-
89
-
90
-
91
-
92
-
93
-
94
-
95
-
96
-
97
-
98
-
99
-
100
-
101
-
102
-
103
-
104
-
105
-
106
-
107
-
108
-
109
-
110
-
111
-
112
-
113
-
114
-
115
-
 116
116 -
 117
117 -
 118
118 -
 119
119 -
 120
120 -
 121
121 -
 122
122 -
 123
123 -
 124
124 -
 125
125 -
 126
126 -
 127
127 -
 128
128 -
 129
129 -
 130
130 -
 131
131 -
 132
132 -
 133
133 -
 134
134 -
 135
135 -
 136
136 -
137
-
138
-
139
-
140
-
141
-
142
-
143
-
144
-
145
-
146
-
147
-
148
-
149
-
150
-
151
-
152
-
153
-
154
-
155
-
156
-
157
-
158
-
159
-
160
-
161
-
162
-
163
-
164
-
165
-
166
-
167
-
168
-
169
-
170
-
171
-
172
-
173
-
174
-
175
-
176
-
177
-
178
-
179
-
180
-
181
-
182
-
183
-
184
-
185
-
186
-
187
-
188
-
189
-
190
-
191
-
192
-
193
-
194
-
195
-
196
-
197
-
198
-
199
-
200
-
201
-
202
-
203
-
204
-
205
-
206
-
207
-
208
-
209
-
210
-
211
-
212
-
213
-
214
-
215
-
216
-
217
-
218
-
219
-
220
-
221
-
222
-
223
-
224
-
225
-
226
-
227
-
228
-
229
-
230
-
231
-
232
 |
 |

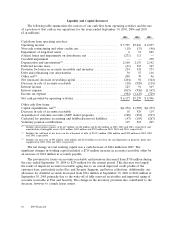
Liquidity and Capital Resources
The following table summarizes the sources of our cash flow from operating activities and the use
of a portion of that cash in our operations for the years ended September 30, 2005, 2004 and 2003
($ in millions):
2005 2004 2003
Cash flows from operating activities:
Operating income .......................................... $5,795 $5,236 $ 2,877
Non-cash restructuring and other credits, net ...................... (18) (33) (46)
Impairment of long-lived assets ................................ 6 51 825
(Gains) losses and impairments on divestitures, net ................. (271) 111 —
Goodwill impairment ....................................... — — 278
Depreciation and amortization(1) ............................... 2,100 2,119 2,142
Deferred income taxes ...................................... (41) 167 367
Provision for losses on accounts receivable and inventory ............. 234 318 573
Debt and refinancing cost amortization .......................... 30 55 116
Other, net(2) .............................................. 200 78 96
Net (increase) decrease in working capital ........................ (204) 94 (344)
Decrease in sale of accounts receivable .......................... (18) (929) (119)
Interest income ........................................... 123 91 107
Interest expense ........................................... (815) (956) (1,147)
Income tax expense ........................................ (984) (1,123) (729)
Net cash provided by operating activities ......................... $6,137 $5,279 $ 4,996
Other cash flow items:
Capital expenditures, net(3) ................................... $(1,272) $ (987) $(1,255)
Decrease in sale of accounts receivable .......................... 18 929 119
Acquisition of customer accounts (ADT dealer program) ............. (328) (254) (597)
Cash paid for purchase accounting and holdback/earn-out liabilities ...... (47) (105) (267)
Voluntary pension contributions ................................ 115 567 205
(1) Includes depreciation expense of $1,447 million, $1,428 million and $1,420 million in 2005, 2004 and 2003, respectively and
amortization of intangible assets ($653 million, $691 million and $722 million in 2005, 2004 and 2003, respectively).
(2) Includes the add-back of net losses on the retirement of debt of $1,013 million, $284 million and $128 million in 2005, 2004
and 2003, respectively.
(3) Includes net proceeds of $94 million, $141 million and $124 million received for the sale/disposition of property, plant and
equipment in 2005, 2004 and 2003, respectively.
The net change in total working capital was a cash decrease of $204 million in 2005. The
significant changes in working capital included a $714 million increase in accounts receivable offset by
an increase of $424 million in accounts payable.
The provision for losses on accounts receivable and inventory decreased from $318 million during
the year ended September 30, 2004 to $234 million for the current period. This decrease was largely
the result of improved accounts receivable aging due to an overall improved credit profile of the
customer base, particularly in the Fire and Security Segment, and better collections. Additionally, our
allowance for doubtful accounts decreased from $516 million at September 30, 2004 to $422 million at
September 30, 2005 primarily due to the write-off of fully reserved receivables and improved aging of
accounts receivable at Fire and Security. The change in the inventory provision also contributed to the
decrease, however to a much lesser extent.
50 2005 Financials