ADT 2005 Annual Report Download - page 113
Download and view the complete annual report
Please find page 113 of the 2005 ADT annual report below. You can navigate through the pages in the report by either clicking on the pages listed below, or by using the keyword search tool below to find specific information within the annual report.-
 1
1 -
2
-
3
-
4
-
5
-
6
-
7
-
8
-
9
-
10
-
11
-
12
-
13
-
14
-
15
-
16
-
17
-
18
-
19
-
20
-
21
-
22
-
23
-
24
-
25
-
26
-
27
-
28
-
29
-
30
-
31
-
32
-
33
-
34
-
35
-
36
-
37
-
38
-
39
-
40
-
41
-
42
-
43
-
44
-
45
-
46
-
47
-
48
-
49
-
50
-
51
-
52
-
53
-
54
-
55
-
56
-
57
-
58
-
59
-
60
-
61
-
62
-
63
-
64
-
65
-
66
-
67
-
68
-
69
-
70
-
71
-
72
-
73
-
74
-
75
-
76
-
77
-
78
-
79
-
80
-
81
-
82
-
83
-
84
-
85
-
86
-
87
-
88
-
89
-
90
-
91
-
92
-
93
-
94
-
95
-
96
-
97
-
98
-
99
-
100
-
101
-
102
-
 103
103 -
 104
104 -
 105
105 -
 106
106 -
 107
107 -
 108
108 -
 109
109 -
 110
110 -
 111
111 -
 112
112 -
 113
113 -
 114
114 -
 115
115 -
 116
116 -
 117
117 -
 118
118 -
 119
119 -
 120
120 -
 121
121 -
 122
122 -
 123
123 -
124
-
125
-
126
-
127
-
128
-
129
-
130
-
131
-
132
-
133
-
134
-
135
-
136
-
137
-
138
-
139
-
140
-
141
-
142
-
143
-
144
-
145
-
146
-
147
-
148
-
149
-
150
-
151
-
152
-
153
-
154
-
155
-
156
-
157
-
158
-
159
-
160
-
161
-
162
-
163
-
164
-
165
-
166
-
167
-
168
-
169
-
170
-
171
-
172
-
173
-
174
-
175
-
176
-
177
-
178
-
179
-
180
-
181
-
182
-
183
-
184
-
185
-
186
-
187
-
188
-
189
-
190
-
191
-
192
-
193
-
194
-
195
-
196
-
197
-
198
-
199
-
200
-
201
-
202
-
203
-
204
-
205
-
206
-
207
-
208
-
209
-
210
-
211
-
212
-
213
-
214
-
215
-
216
-
217
-
218
-
219
-
220
-
221
-
222
-
223
-
224
-
225
-
226
-
227
-
228
-
229
-
230
-
231
-
232
 |
 |

Fire and Security
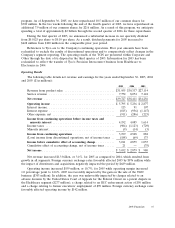
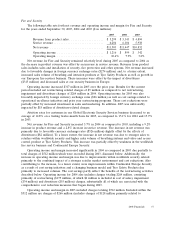
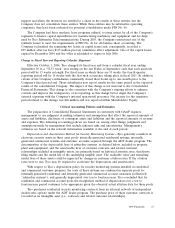
The following table sets forth net revenue and operating income and margin for Fire and Security
for the years ended September 30, 2005, 2004 and 2003 ($ in millions):
2005 2004 2003
Revenue from product sales .................... $ 5,299 $ 5,343 $ 4,894
Service revenue ............................. 6,204 6,104 5,938
Net revenue ............................... $11,503 $11,447 $10,832
Operating income ........................... $ 1,216 $ 899 $ 342
Operating margin ........................... 10.6% 7.9% 3.2%
Net revenue for Fire and Security remained relatively level during 2005 as compared to 2004 as
the decrease in product revenue was offset by an increase in service revenue. Revenue from product
sales includes sales and installation of security, fire protection and other systems. Net revenue increased
due to favorable changes in foreign currency exchange rates ($274 million) and, to a lesser extent,
increased sales volume of breathing and intrusion products at Tyco Safety Products as well as growth in
our European fire services business. These increases were offset by the impact of divestitures
($315 million) and decreased sales at our security business in Europe.
Operating income increased $317 million in 2005 over the prior year. Results for the current
period included net restructuring related charges of $9 million as compared to net restructuring,
impairment and divestiture charges of $264 million in 2004. Operating income for 2005 was also
favorably impacted by foreign currency exchange rates ($26 million) as well as cost savings related to
operational excellence initiatives and prior year restructuring programs. These cost reductions were
partially offset by increased investment in sales and marketing. In addition, 2005 was unfavorably
impacted by $18 million of divestiture-related charges.
Attrition rates for customers in our Global Electronic Security Services business decreased to an
average of 14.8% on a trailing twelve-month basis for 2005, as compared to 15.1% for 2004 and 15.9%
in 2003.
Net revenue for Fire and Security increased 5.7% in 2004 as compared to 2003, including a 9.2%
increase in product revenue and a 2.8% increase in service revenue. The increase in net revenue was
primarily due to favorable currency exchange rates ($526 million) slightly offset by the effects of
divestitures ($82 million). To a lesser extent, the increase in net revenue was due to stronger sales to
retailers within worldwide security and higher sales volume of breathing systems and video and access
control product at Tyco Safety Products. This increase was partially offset by weakness in the worldwide
fire service business and Continental Europe Security.
Operating income and margin increased significantly in 2004 as compared in 2003 due partially to
total charges of $512 million which were recorded during 2003, discussed below. Additionally, the
increase in operating income and margin was due to improvements within worldwide security related
primarily to the combined impact of a stronger retailer market environment and cost reductions. Also
contributing to the increase, to a lesser extent, were improvements within Continental Europe Security
as a result of cost saving initiatives and a changing business model and Tyco Safety Products due
primarily to increased volumes. The cost savings partly reflect the benefits of the restructuring activities
described below. Operating income for 2004 also includes charges totaling $264 million, consisting
primarily of restructuring ($175 million, of which $4 million is included in cost of sales), impairment
($34 million) and divestiture ($55 million) charges, substantially all of which are associated with the
comprehensive cost reduction measures that began during 2003.
Operating income and margin in 2003 included charges totaling $512 million. Included within the
$512 million are charges of $266 million (includes charges of $128 million primarily related to
2005 Financials 37