ADT 2005 Annual Report Download - page 118
Download and view the complete annual report
Please find page 118 of the 2005 ADT annual report below. You can navigate through the pages in the report by either clicking on the pages listed below, or by using the keyword search tool below to find specific information within the annual report.-
 1
1 -
2
-
3
-
4
-
5
-
6
-
7
-
8
-
9
-
10
-
11
-
12
-
13
-
14
-
15
-
16
-
17
-
18
-
19
-
20
-
21
-
22
-
23
-
24
-
25
-
26
-
27
-
28
-
29
-
30
-
31
-
32
-
33
-
34
-
35
-
36
-
37
-
38
-
39
-
40
-
41
-
42
-
43
-
44
-
45
-
46
-
47
-
48
-
49
-
50
-
51
-
52
-
53
-
54
-
55
-
56
-
57
-
58
-
59
-
60
-
61
-
62
-
63
-
64
-
65
-
66
-
67
-
68
-
69
-
70
-
71
-
72
-
73
-
74
-
75
-
76
-
77
-
78
-
79
-
80
-
81
-
82
-
83
-
84
-
85
-
86
-
87
-
88
-
89
-
90
-
91
-
92
-
93
-
94
-
95
-
96
-
97
-
98
-
99
-
100
-
101
-
102
-
103
-
104
-
105
-
106
-
107
-
 108
108 -
 109
109 -
 110
110 -
 111
111 -
 112
112 -
 113
113 -
 114
114 -
 115
115 -
 116
116 -
 117
117 -
 118
118 -
 119
119 -
 120
120 -
 121
121 -
 122
122 -
 123
123 -
 124
124 -
 125
125 -
 126
126 -
 127
127 -
 128
128 -
129
-
130
-
131
-
132
-
133
-
134
-
135
-
136
-
137
-
138
-
139
-
140
-
141
-
142
-
143
-
144
-
145
-
146
-
147
-
148
-
149
-
150
-
151
-
152
-
153
-
154
-
155
-
156
-
157
-
158
-
159
-
160
-
161
-
162
-
163
-
164
-
165
-
166
-
167
-
168
-
169
-
170
-
171
-
172
-
173
-
174
-
175
-
176
-
177
-
178
-
179
-
180
-
181
-
182
-
183
-
184
-
185
-
186
-
187
-
188
-
189
-
190
-
191
-
192
-
193
-
194
-
195
-
196
-
197
-
198
-
199
-
200
-
201
-
202
-
203
-
204
-
205
-
206
-
207
-
208
-
209
-
210
-
211
-
212
-
213
-
214
-
215
-
216
-
217
-
218
-
219
-
220
-
221
-
222
-
223
-
224
-
225
-
226
-
227
-
228
-
229
-
230
-
231
-
232
 |
 |
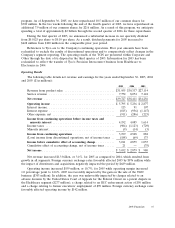
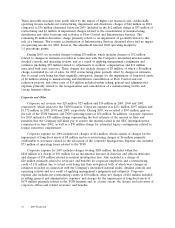
These favorable increases were partly offset by the impact of higher raw material costs. Additionally,
operating income includes net restructuring, impairment and divestiture charges of $62 million in 2004
compared to $56 million (discussed below) in 2003. Included in the $62 million charge is $53 million of
restructuring and $4 million of impairment charges related to the consolidation of manufacturing,
distribution and office locations and activities at Flow Control and Infrastructure Services. The
remaining $5 million divestiture charge primarily relates to an impairment of goodwill related to the
sale of a business. The revenue reclassification at Infrastructure Services discussed above had no impact
on operating income for 2004; however, this adjustment lowered 2004 operating margin by
1.5 percentage points.
During 2003, we recorded charges totaling $56 million, which includes charges of $32 million
related to changes in estimates recorded in connection with the Company’s intensified internal audits,
detailed controls and operating reviews, and as a result of applying management’s judgments and
estimates (including $19 million related to adjustments to workers’ compensation and $13 million
associated with asset reserves). These charges also include charges of $8 million, of which a $6 million
charge is included in cost of sales, for 2003 restructuring plans partially offset by changes in estimates
due to actual costs being less than originally anticipated, charges for the impairment of long-lived assets
of $2 million relating to manufacturing and distribution consolidation at Flow Control and cost
reduction projects, and other costs of $14 million included within selling, general and administrative
expenses primarily related to the reorganization and consolidation of a manufacturing facility and
certain business offices.
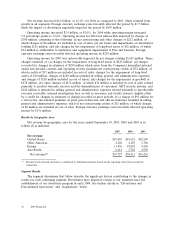
Corporate and Other
Corporate net revenue was $29 million, $25 million and $14 million in 2005, 2004 and 2003,
respectively, which related to the TGN business. Corporate expense was $231 million, $397 million and
$1,172 million in 2005, 2004 and 2003, respectively. During 2005, we recorded a $303 million gain on
the sale of the TGN business and TGN operating losses of $54 million. In addition, corporate expenses
for 2005 included a $50 million charge representing the best estimate of the amount in fines and
penalties that the Company will likely pay to resolve the matters raised in the SEC investigation that
commenced in June 2002, as well as a $70 million charge for estimated legacy contingencies related to
former executives’ employment.
Corporate expense for 2004 includes net charges of $14 million, which consists of charges for the
impairment of long-lived assets of $8 million and net restructuring charges of $6 million primarily
attributable to severance related to the relocation of the corporate headquarters. Expense also included
$73 million of operating losses related to the TGN.
Corporate expense for 2003 includes charges totaling $824 million. Included within the
$824 million is a charge of $91 million for an incremental increase in directors and officers insurance
and charges of $39 million related to internal investigation fees. Also included is a charge of
$20 million primarily related to severance and benefits for corporate employees and a restructuring
credit of $11 million due to actual costs being less than anticipated, both of which were changes in
estimates recorded in connection with the Company’s intensified internal audits, detailed controls and
operating reviews and as a result of applying management’s judgments and estimates. Corporate
expense also includes net restructuring credits of $10 million, other net charges of $16 million included
in selling, general and administrative expenses, and charges for the impairment of long-lived assets of
$679 million primarily related to the TGN business and, to a lesser extent, the closure and relocation of
corporate offices and related severance and benefits.
42 2005 Financials