ADT 2005 Annual Report Download - page 203
Download and view the complete annual report
Please find page 203 of the 2005 ADT annual report below. You can navigate through the pages in the report by either clicking on the pages listed below, or by using the keyword search tool below to find specific information within the annual report.-
 1
1 -
2
-
3
-
4
-
5
-
6
-
7
-
8
-
9
-
10
-
11
-
12
-
13
-
14
-
15
-
16
-
17
-
18
-
19
-
20
-
21
-
22
-
23
-
24
-
25
-
26
-
27
-
28
-
29
-
30
-
31
-
32
-
33
-
34
-
35
-
36
-
37
-
38
-
39
-
40
-
41
-
42
-
43
-
44
-
45
-
46
-
47
-
48
-
49
-
50
-
51
-
52
-
53
-
54
-
55
-
56
-
57
-
58
-
59
-
60
-
61
-
62
-
63
-
64
-
65
-
66
-
67
-
68
-
69
-
70
-
71
-
72
-
73
-
74
-
75
-
76
-
77
-
78
-
79
-
80
-
81
-
82
-
83
-
84
-
85
-
86
-
87
-
88
-
89
-
90
-
91
-
92
-
93
-
94
-
95
-
96
-
97
-
98
-
99
-
100
-
101
-
102
-
103
-
104
-
105
-
106
-
107
-
108
-
109
-
110
-
111
-
112
-
113
-
114
-
115
-
116
-
117
-
118
-
119
-
120
-
121
-
122
-
123
-
124
-
125
-
126
-
127
-
128
-
129
-
130
-
131
-
132
-
133
-
134
-
135
-
136
-
137
-
138
-
139
-
140
-
141
-
142
-
143
-
144
-
145
-
146
-
147
-
148
-
149
-
150
-
151
-
152
-
153
-
154
-
155
-
156
-
157
-
158
-
159
-
160
-
161
-
162
-
163
-
164
-
165
-
166
-
167
-
168
-
169
-
170
-
171
-
172
-
173
-
174
-
175
-
176
-
177
-
178
-
179
-
180
-
181
-
182
-
183
-
184
-
185
-
186
-
187
-
188
-
189
-
190
-
191
-
192
-
 193
193 -
 194
194 -
 195
195 -
 196
196 -
 197
197 -
 198
198 -
 199
199 -
 200
200 -
 201
201 -
 202
202 -
 203
203 -
 204
204 -
 205
205 -
 206
206 -
 207
207 -
 208
208 -
 209
209 -
 210
210 -
 211
211 -
 212
212 -
 213
213 -
214
-
215
-
216
-
217
-
218
-
219
-
220
-
221
-
222
-
223
-
224
-
225
-
226
-
227
-
228
-
229
-
230
-
231
-
232
 |
 |

TYCO INTERNATIONAL LTD.
NOTES TO CONSOLIDATED FINANCIAL STATEMENTS
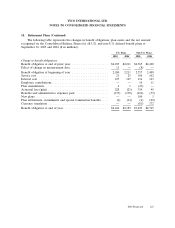
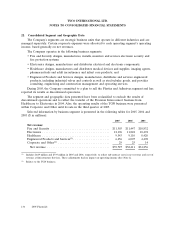
18. Retirement Plans (Continued)
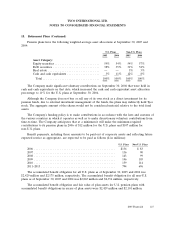
Pension plans have the following weighted-average asset allocations at September 30, 2005 and
2004:
U.S. Plans Non-U.S. Plans
2005 2004 2005 2004
Asset Category:
Equity securities .......................... 59% 54% 54% 57%
Debt securities ........................... 38% 35% 31% 32%
Real estate .............................. — — 3% 3%
Cash and cash equivalents ................... 3% 11% 12% 8%
Total ................................. 100% 100% 100% 100%
The Company made significant voluntary contributions on September 30, 2004 that were held in
cash and cash equivalents on that date, which increased the cash and cash equivalent asset allocation
percentage to 11% for the U.S. plans at September 30, 2004.
Although the Company does not buy or sell any of its own stock as a direct investment for its
pension funds, due to external investment management of the funds, the plans may indirectly hold Tyco
stock. The aggregate amount of the shares would not be considered material relative to the total fund
assets.
The Company’s funding policy is to make contributions in accordance with the laws and customs of
the various countries in which it operates as well as to make discretionary voluntary contributions from
time-to-time. The Company anticipates that at a minimum it will make the minimum required
contributions to its pension plans in 2006 of $12 million for the U.S. plans and $107 million for
non-U.S. plans.
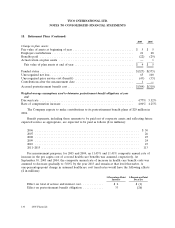
Benefit payments, including those amounts to be paid out of corporate assets and reflecting future
expected service as appropriate, are expected to be paid as follows ($ in millions):
U.S. Plans Non-U.S. Plans
2006 ............................................... $136 $ 83
2007 ............................................... 136 90
2008 ............................................... 143 99
2009 ............................................... 146 105
2010 ............................................... 159 114
2011–2015 ........................................... 794 696
The accumulated benefit obligation for all U.S. plans as of September 30, 2005 and 2004 was
$2,429 million and $2,175 million, respectively. The accumulated benefit obligation for all non-U.S.
plans as of September 30, 2005 and 2004 was $2,865 million and $2,356 million, respectively.
The accumulated benefit obligation and fair value of plan assets for U.S. pension plans with
accumulated benefit obligations in excess of plan assets were $2,429 million and $2,101 million,
2005 Financials 127