ADT 2005 Annual Report Download - page 115
Download and view the complete annual report
Please find page 115 of the 2005 ADT annual report below. You can navigate through the pages in the report by either clicking on the pages listed below, or by using the keyword search tool below to find specific information within the annual report.-
 1
1 -
2
-
3
-
4
-
5
-
6
-
7
-
8
-
9
-
10
-
11
-
12
-
13
-
14
-
15
-
16
-
17
-
18
-
19
-
20
-
21
-
22
-
23
-
24
-
25
-
26
-
27
-
28
-
29
-
30
-
31
-
32
-
33
-
34
-
35
-
36
-
37
-
38
-
39
-
40
-
41
-
42
-
43
-
44
-
45
-
46
-
47
-
48
-
49
-
50
-
51
-
52
-
53
-
54
-
55
-
56
-
57
-
58
-
59
-
60
-
61
-
62
-
63
-
64
-
65
-
66
-
67
-
68
-
69
-
70
-
71
-
72
-
73
-
74
-
75
-
76
-
77
-
78
-
79
-
80
-
81
-
82
-
83
-
84
-
85
-
86
-
87
-
88
-
89
-
90
-
91
-
92
-
93
-
94
-
95
-
96
-
97
-
98
-
99
-
100
-
101
-
102
-
103
-
104
-
 105
105 -
 106
106 -
 107
107 -
 108
108 -
 109
109 -
 110
110 -
 111
111 -
 112
112 -
 113
113 -
 114
114 -
 115
115 -
 116
116 -
 117
117 -
 118
118 -
 119
119 -
 120
120 -
 121
121 -
 122
122 -
 123
123 -
 124
124 -
 125
125 -
126
-
127
-
128
-
129
-
130
-
131
-
132
-
133
-
134
-
135
-
136
-
137
-
138
-
139
-
140
-
141
-
142
-
143
-
144
-
145
-
146
-
147
-
148
-
149
-
150
-
151
-
152
-
153
-
154
-
155
-
156
-
157
-
158
-
159
-
160
-
161
-
162
-
163
-
164
-
165
-
166
-
167
-
168
-
169
-
170
-
171
-
172
-
173
-
174
-
175
-
176
-
177
-
178
-
179
-
180
-
181
-
182
-
183
-
184
-
185
-
186
-
187
-
188
-
189
-
190
-
191
-
192
-
193
-
194
-
195
-
196
-
197
-
198
-
199
-
200
-
201
-
202
-
203
-
204
-
205
-
206
-
207
-
208
-
209
-
210
-
211
-
212
-
213
-
214
-
215
-
216
-
217
-
218
-
219
-
220
-
221
-
222
-
223
-
224
-
225
-
226
-
227
-
228
-
229
-
230
-
231
-
232
 |
 |

The 40.9% increase in operating income and the 3.0 percentage point increase in margin in 2004
as compared to 2003 were primarily due to the revenue growth discussed above, cost savings initiatives
that were executed in 2003, the positive impact of foreign currency ($90 million) and fewer charges
recorded in 2004 as compared to 2003. These increases in operating income were partially offset by an
80 basis point impact of increased metal prices for copper and gold. Operating income for 2004
includes net restructuring, divestiture and impairment charges totaling $22 million. These net charges
include a $52 million charge related to the divestiture of the Electrical Contracting Services business,
partially offset by $33 million of net restructuring credits related to changes in estimates of severance,
facility exit costs, distributor and supplier cancellation fees recorded in prior periods and the impact of
the sale of assets that were impaired in prior years for amounts greater than originally anticipated.
These net charges also include a $3 million charge related to the impairment of property, plant, and
equipment.
Operating income and margin for 2003 include net charges totaling $236 million. The $236 million
consists primarily of charges for the impairment of goodwill of $278 million in Power Systems,
Electrical Contracting Services and the Printed Circuit Group, restructuring credits of $72 million, of
which $20 million is included in cost of sales, related primarily to changes in estimates of severance and
facility exit costs recorded in prior years and charges for the impairment of long-lived assets of
$1 million. The net restructuring credit of $72 million includes $55 million of credits, which were
changes in estimates recorded in connection with the Company’s intensified internal audits and detailed
controls and operating reviews performed during 2003. Also included within the $236 million are
charges of $14 million related to adjusting asset reserves, $6 million related to the adjustments to
accrual balances, and $9 million of reconciliation and other accounting adjustments, which were also
recorded in connection with the Company’s intensified internal audits and detailed controls and
operating reviews performed during 2003.
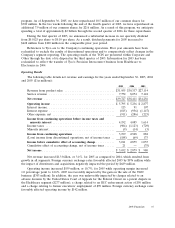
Healthcare
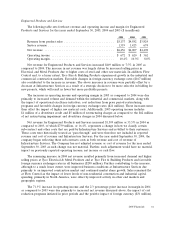
The following table sets forth net revenue and operating income and margin for Healthcare for the
years ended September 30, 2005, 2004 and 2003 ($ in millions):
2005 2004 2003
Revenue from product sales ............................. $9,477 $9,040 $8,344
Service revenue ...................................... 66 70 76
Net revenue ........................................ $9,543 $9,110 $8,420
Operating income .................................... $2,286 $2,365 $2,104
Operating margin ..................................... 24.0% 26.0% 25.0%
Net revenue for Healthcare increased $433 million or 4.8% in 2005 as compared to 2004. This
increase resulted primarily from growth in existing businesses and, to a lesser extent, favorable changes
in foreign currency exchange rates ($141 million). Growth in Healthcare’s underlying businesses was
principally driven by increased revenue within Medical Devices & Supplies which was largely the result
of increased sales volume in the International division, primarily in Europe, due to a salesforce
investment and sales growth in vessel sealing, laparoscopy, and stapling. Increased sales at the Surgical
division within Medical Devices & Supplies also strongly contributed, due to enhanced contracting with
group purchasing organizations, increased acceptance of Laparoscopic Gastric By-Pass procedures and
increased adoption of LigaSure device. Pharmaceuticals also contributed to the increase in revenue,
although to a lesser extent. These increases were partially offset by decreased sales in Retail primarily
due to a difficult competitive environment and customer consolidations.
2005 Financials 39