ADT 2005 Annual Report Download - page 41
Download and view the complete annual report
Please find page 41 of the 2005 ADT annual report below. You can navigate through the pages in the report by either clicking on the pages listed below, or by using the keyword search tool below to find specific information within the annual report.-
 1
1 -
2
-
3
-
4
-
5
-
6
-
7
-
8
-
9
-
10
-
11
-
12
-
13
-
14
-
15
-
16
-
17
-
18
-
19
-
20
-
21
-
22
-
23
-
24
-
25
-
26
-
27
-
28
-
29
-
30
-
 31
31 -
 32
32 -
 33
33 -
 34
34 -
 35
35 -
 36
36 -
 37
37 -
 38
38 -
 39
39 -
 40
40 -
 41
41 -
 42
42 -
 43
43 -
 44
44 -
 45
45 -
 46
46 -
 47
47 -
 48
48 -
 49
49 -
 50
50 -
 51
51 -
52
-
53
-
54
-
55
-
56
-
57
-
58
-
59
-
60
-
61
-
62
-
63
-
64
-
65
-
66
-
67
-
68
-
69
-
70
-
71
-
72
-
73
-
74
-
75
-
76
-
77
-
78
-
79
-
80
-
81
-
82
-
83
-
84
-
85
-
86
-
87
-
88
-
89
-
90
-
91
-
92
-
93
-
94
-
95
-
96
-
97
-
98
-
99
-
100
-
101
-
102
-
103
-
104
-
105
-
106
-
107
-
108
-
109
-
110
-
111
-
112
-
113
-
114
-
115
-
116
-
117
-
118
-
119
-
120
-
121
-
122
-
123
-
124
-
125
-
126
-
127
-
128
-
129
-
130
-
131
-
132
-
133
-
134
-
135
-
136
-
137
-
138
-
139
-
140
-
141
-
142
-
143
-
144
-
145
-
146
-
147
-
148
-
149
-
150
-
151
-
152
-
153
-
154
-
155
-
156
-
157
-
158
-
159
-
160
-
161
-
162
-
163
-
164
-
165
-
166
-
167
-
168
-
169
-
170
-
171
-
172
-
173
-
174
-
175
-
176
-
177
-
178
-
179
-
180
-
181
-
182
-
183
-
184
-
185
-
186
-
187
-
188
-
189
-
190
-
191
-
192
-
193
-
194
-
195
-
196
-
197
-
198
-
199
-
200
-
201
-
202
-
203
-
204
-
205
-
206
-
207
-
208
-
209
-
210
-
211
-
212
-
213
-
214
-
215
-
216
-
217
-
218
-
219
-
220
-
221
-
222
-
223
-
224
-
225
-
226
-
227
-
228
-
229
-
230
-
231
-
232
 |
 |

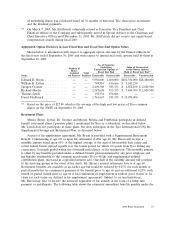
EXECUTIVE OFFICER COMPENSATION
Summary Compensation Table
The table below presents the annual and long-term compensation for services in all capacities to
Tyco and its subsidiaries for the periods shown for Tyco’s Chief Executive Officer and the other five
most highly compensated executive officers of Tyco during fiscal 2005 (the ‘‘Named Officers’’). No
executive officer who would otherwise have been includable in such table on the basis of compensation
for fiscal 2005 has been excluded by reason of his or her termination of employment or change in
executive status during the fiscal year. All dollar amounts are in United States dollars unless otherwise
indicated.
Long Term
Annual Compensation Compensation
Shares
Other Restricted Underlying
Annual Stock/DSU Stock All Other
Name & Principal Position Year Salary Bonus Compensation(3) (Value)(7) Options Compensation(8)
Corporate Executive Officers
Edward D. Breen ............... 2005 $1,570,617 $1,485,088 $186,407(4) $5,728,000 600,000 $336,339
Chairman & CEO 2004 $1,540,000 $3,120,000 $271,936(5) $5,559,000 600,000 $242,483(12)
2003 $1,500,000 $1,500,000 $425,293(6) — — $330,250
William B. Lytton .............. 2005 $ 675,000 $ 616,883 $189,997(4) $1,611,000 250,000 $167,046
Executive Vice President & 2004 $ 662,500 $1,350,000 $211,037(5) $1,111,800 250,000 $123,274(12)
General Counsel 2003 $ 650,000 $ 650,000 $129,603(6) — — $ 86,540
Business Segment Presidents
Juergen W. Gromer(1) ............ 2005 $ 998,372 $ 399,588 —(4) $1,611,000 250,000 —
President, Tyco Electronics 2004 $ 999,575 $1,999,149 —(5) $1,667,700 275,000 —
2003 $ 916,637 $1,992,328(2) —(6) $ 713,500 450,000 —
Richard Meelia ................ 2005 $ 718,375 $ 719,211 $133,917(4) $1,253,000 200,000 $200,367
President, Tyco Healthcare 2004 $ 741,807 $ 848,820 $140,175(5) $1,668,000 275,000 $219,252
2003 $ 687,192 $1,190,000 $ 88,684(6) $ 713,500 450,000 $288,429
Thomas Lynch(9) ............... 2005 $ 675,000 $ 697,343 $131,819(4)(10) $1,253,000 200,000 $109,231
President, Tyco Engineered 2004 — — — $3,579,600 415,000 —
Products and Services
Other Named Officers
David J. FitzPatrick(11) ........... 2005 $ 780,000 $ 712,842 $394,203(4) — — $ 67,557
Special Advisor to the Chairman 2004 $ 765,000 $1,560,000 $405,450(5) $1,667,700 275,000 $ 64,986
and CEO 2003 $ 750,000 $ 750,000 $697,452(6) — — $101,649
(1) Dr. Gromer’s salary and bonus are paid in Euros, with one-third of his salary attributable to his employment status with Tyco
Electronics in Germany, and two-thirds attributable to his employment status with Tyco Electronics Logistics AG in
Switzerland. For purposes of the above table, Dr. Gromer’s salary and bonus have been converted from Euros to U.S.
dollars (‘‘USD’’) as follows: for fiscal 2005, the September 30, 2005 conversion rate of 1 Euro to 1.2058 USD was used; for
fiscal 2004, the September 30, 2004 conversion rate of 1 Euro to 1.2319 USD was used; and for fiscal 2003, the
September 30, 2003 conversion rate of 1 Euro to 1.1597 USD was used. In March 2005, Dr. Gromer’s salary was increased
to A839,808.
(2) Dr. Gromer’s 2003 bonus includes a cash bonus in the amount of $1,558,283 (converted from Euros based on the
September 30, 2003 conversion rate described in footnote 1 above) plus the value of 19,390 performance-based shares
granted on October 3, 2000, which vested on November 7, 2003, equal to $434,045, based on the fair market value per share
of $22.385 on the date of vesting. These performance-based shares were outstanding from Tyco’s prior annual incentive
program in which segment presidents had the opportunity to earn a portion of their bonus in the form of shares.
(3) Other Annual Compensation includes the cost of providing various perquisites and other personal benefits if the amount
exceeds $50,000 in the aggregate in any year, and the indicated footnotes list items that individually comprise more than
25% of this value. Other Annual Compensation also includes all tax or tax gross-up payments.
2006 Proxy Statement 23