ADT 2005 Annual Report Download - page 107
Download and view the complete annual report
Please find page 107 of the 2005 ADT annual report below. You can navigate through the pages in the report by either clicking on the pages listed below, or by using the keyword search tool below to find specific information within the annual report.-
 1
1 -
2
-
3
-
4
-
5
-
6
-
7
-
8
-
9
-
10
-
11
-
12
-
13
-
14
-
15
-
16
-
17
-
18
-
19
-
20
-
21
-
22
-
23
-
24
-
25
-
26
-
27
-
28
-
29
-
30
-
31
-
32
-
33
-
34
-
35
-
36
-
37
-
38
-
39
-
40
-
41
-
42
-
43
-
44
-
45
-
46
-
47
-
48
-
49
-
50
-
51
-
52
-
53
-
54
-
55
-
56
-
57
-
58
-
59
-
60
-
61
-
62
-
63
-
64
-
65
-
66
-
67
-
68
-
69
-
70
-
71
-
72
-
73
-
74
-
75
-
76
-
77
-
78
-
79
-
80
-
81
-
82
-
83
-
84
-
85
-
86
-
87
-
88
-
89
-
90
-
91
-
92
-
93
-
94
-
95
-
96
-
 97
97 -
 98
98 -
 99
99 -
 100
100 -
 101
101 -
 102
102 -
 103
103 -
 104
104 -
 105
105 -
 106
106 -
 107
107 -
 108
108 -
 109
109 -
 110
110 -
 111
111 -
 112
112 -
 113
113 -
 114
114 -
 115
115 -
 116
116 -
 117
117 -
118
-
119
-
120
-
121
-
122
-
123
-
124
-
125
-
126
-
127
-
128
-
129
-
130
-
131
-
132
-
133
-
134
-
135
-
136
-
137
-
138
-
139
-
140
-
141
-
142
-
143
-
144
-
145
-
146
-
147
-
148
-
149
-
150
-
151
-
152
-
153
-
154
-
155
-
156
-
157
-
158
-
159
-
160
-
161
-
162
-
163
-
164
-
165
-
166
-
167
-
168
-
169
-
170
-
171
-
172
-
173
-
174
-
175
-
176
-
177
-
178
-
179
-
180
-
181
-
182
-
183
-
184
-
185
-
186
-
187
-
188
-
189
-
190
-
191
-
192
-
193
-
194
-
195
-
196
-
197
-
198
-
199
-
200
-
201
-
202
-
203
-
204
-
205
-
206
-
207
-
208
-
209
-
210
-
211
-
212
-
213
-
214
-
215
-
216
-
217
-
218
-
219
-
220
-
221
-
222
-
223
-
224
-
225
-
226
-
227
-
228
-
229
-
230
-
231
-
232
 |
 |

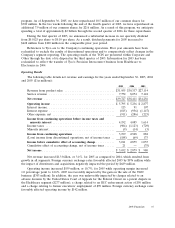
PART II
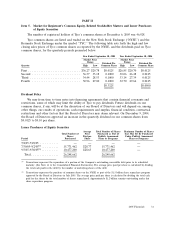
Item 5. Market for Registrant’s Common Equity, Related Stockholder Matters and Issuer Purchases
of Equity Securities
The number of registered holders of Tyco’s common shares at December 6, 2005 was 46,928.
Tyco common shares are listed and traded on the New York Stock Exchange (‘‘NYSE’’) and the
Bermuda Stock Exchange under the symbol ‘‘TYC.’’ The following table sets forth the high and low
closing sales prices of Tyco common shares as reported by the NYSE, and the dividends paid on Tyco
common shares, for the quarterly periods presented below.
Year Ended September 30, 2005 Year Ended September 30, 2004
Market Price Market Price
Range Range
Dividend Per Dividend Per
Quarter High Low Common Share High Low Common Share
First .............................. $36.27 $29.78 $0.0125 $26.85 $20.70 $0.0125
Second ............................ 36.37 33.18 0.1000 30.06 26.48 0.0125
Third ............................. 34.44 28.53 0.1000 33.14 27.39 0.0125
Fourth ............................ 30.96 27.00 0.1000 32.70 29.66 0.0125
$0.3125 $0.0500
Dividend Policy
We may from time to time enter into financing agreements that contain financial covenants and
restrictions, some of which may limit the ability of Tyco to pay dividends. Future dividends on our
common shares, if any, will be at the discretion of our Board of Directors and will depend on, among
other things, our results of operations, cash requirements and surplus, financial condition, contractual
restrictions and other factors that the Board of Directors may deem relevant. On December 9, 2004,
the Board of Directors approved an increase in the quarterly dividend on our common shares from
$0.0125 to $0.10 per share.
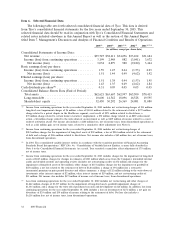
Issuer Purchases of Equity Securities
Average Total Number of Shares Maximum Number of Shares
Total Number of Price Purchased as Part of that May Yet Be Purchased
Shares Paid per Publicly Announced Under Publicly Announced
Period Purchased Share Plans or Programs Plans or Programs
7/2/05-7/29/05 ........... — — — —
7/30/05-9/2/05(1) .......... 15,771,462 $28.77 15,771,462 —
9/3/05-9/30/05(2) .......... 10,477,200 $28.63 10,477,200 —
Total ................ 26,248,662 26,248,662
(1) Transactions represent the repurchase of a portion of the Company’s outstanding convertible debt prior to its scheduled
maturity. (See Note 14 to the Consolidated Financial Statements). The average price paid per share is calculated by dividing
the total cash paid for the debt by the number of underlying shares of the debt.
(2) Transactions represent the purchase of common shares on the NYSE as part of the $1.5 billion share repurchase program
approved by the Board of Directors in July 2005. The average price paid per share is calculated by dividing the total cash
paid for the shares by the total number of shares repurchased. Approximately $1.2 billion remains outstanding under this
share repurchase program.
2005 Financials 31