ADT 2005 Annual Report Download - page 218
Download and view the complete annual report
Please find page 218 of the 2005 ADT annual report below. You can navigate through the pages in the report by either clicking on the pages listed below, or by using the keyword search tool below to find specific information within the annual report.-
 1
1 -
2
-
3
-
4
-
5
-
6
-
7
-
8
-
9
-
10
-
11
-
12
-
13
-
14
-
15
-
16
-
17
-
18
-
19
-
20
-
21
-
22
-
23
-
24
-
25
-
26
-
27
-
28
-
29
-
30
-
31
-
32
-
33
-
34
-
35
-
36
-
37
-
38
-
39
-
40
-
41
-
42
-
43
-
44
-
45
-
46
-
47
-
48
-
49
-
50
-
51
-
52
-
53
-
54
-
55
-
56
-
57
-
58
-
59
-
60
-
61
-
62
-
63
-
64
-
65
-
66
-
67
-
68
-
69
-
70
-
71
-
72
-
73
-
74
-
75
-
76
-
77
-
78
-
79
-
80
-
81
-
82
-
83
-
84
-
85
-
86
-
87
-
88
-
89
-
90
-
91
-
92
-
93
-
94
-
95
-
96
-
97
-
98
-
99
-
100
-
101
-
102
-
103
-
104
-
105
-
106
-
107
-
108
-
109
-
110
-
111
-
112
-
113
-
114
-
115
-
116
-
117
-
118
-
119
-
120
-
121
-
122
-
123
-
124
-
125
-
126
-
127
-
128
-
129
-
130
-
131
-
132
-
133
-
134
-
135
-
136
-
137
-
138
-
139
-
140
-
141
-
142
-
143
-
144
-
145
-
146
-
147
-
148
-
149
-
150
-
151
-
152
-
153
-
154
-
155
-
156
-
157
-
158
-
159
-
160
-
161
-
162
-
163
-
164
-
165
-
166
-
167
-
168
-
169
-
170
-
171
-
172
-
173
-
174
-
175
-
176
-
177
-
178
-
179
-
180
-
181
-
182
-
183
-
184
-
185
-
186
-
187
-
188
-
189
-
190
-
191
-
192
-
193
-
194
-
195
-
196
-
197
-
198
-
199
-
200
-
201
-
202
-
203
-
204
-
205
-
206
-
207
-
 208
208 -
 209
209 -
 210
210 -
 211
211 -
 212
212 -
 213
213 -
 214
214 -
 215
215 -
 216
216 -
 217
217 -
 218
218 -
 219
219 -
 220
220 -
 221
221 -
 222
222 -
 223
223 -
 224
224 -
 225
225 -
 226
226 -
 227
227 -
 228
228 -
229
-
230
-
231
-
232
 |
 |

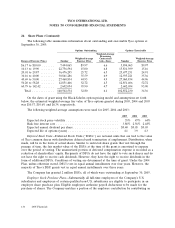
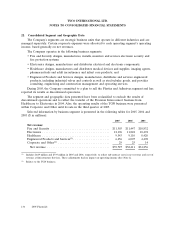
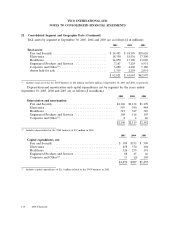
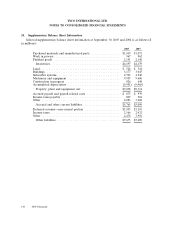
TYCO INTERNATIONAL LTD.
NOTES TO CONSOLIDATED FINANCIAL STATEMENTS
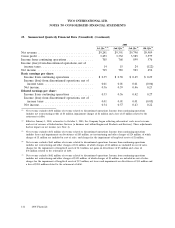
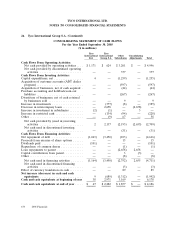
25. Summarized Quarterly Financial Data (Unaudited) (Continued)
2004
1st Qtr.(1)(2) 2nd Qtr.(3) 3rd Qtr.(4) 4th Qtr.(5)
Net revenue ................................ $9,241 $9,391 $9,790 $9,989
Gross profit ................................ 3,253 3,332 3,589 3,577
Income from continuing operations ............... 705 768 899 576
Income (loss) from discontinued operations, net of
income taxes .............................. 14 15 24 (122)
Net income ................................ 719 783 923 454
Basic earnings per share:
Income from continuing operations ............. $ 0.35 $ 0.38 $ 0.45 $ 0.29
Income (loss) from discontinued operations, net of
income taxes ............................ 0.01 0.01 0.01 (0.06)
Net income ............................... 0.36 0.39 0.46 0.23
Diluted earnings per share:
Income from continuing operations ............. 0.33 0.36 0.42 0.27
Income (loss) from discontinued operations, net of
income taxes ............................ 0.01 0.01 0.01 (0.05)
Net income ............................... 0.34 0.37 0.43 0.22
(1) Net revenue excludes $638 million of revenue related to discontinued operations. Income from continuing operations
includes net restructuring credits of $3 million, impairment charges of $1 million and a loss of $5 million related to the
retirement of debt.
(2) Effective January 1, 2004, retroactive to October 1, 2003, the Company began reflecting sub-contract costs in net revenue
and cost of revenue at Infrastructure Services (a business unit within Engineered Products and Services). These adjustments
had no impact on net income (see Note 1).
(3) Net revenue excludes $651 million of revenue related to discontinued operations. Income from continuing operations
includes losses and impairments on divestitures of $85 million, net restructuring and other charges of $24 million, of which
charges of $1 million are included in cost of sales, and charges for the impairment of long-lived assets of $1 million.
(4) Net revenue excludes $661 million of revenue related to discontinued operations. Income from continuing operations
includes net restructuring and other charges of $36 million, of which charges of $2 million are included in cost of sales,
charges for the impairment of long-lived assets of $13 million, net gains on divestitures of $3 million and a loss of
$38 million related to the retirement of debt.
(5) Net revenue excludes $681 million of revenue related to discontinued operations. Income from continuing operations
includes net restructuring and other charges of $155 million, of which charges of $3 million are included in cost of sales,
charges for the impairment of long-lived assets of $37 million, net losses and impairments on divestitures of $34 million and
a loss of $241 million related to the retirement of debt.
142 2005 Financials