ADT 2005 Annual Report Download - page 184
Download and view the complete annual report
Please find page 184 of the 2005 ADT annual report below. You can navigate through the pages in the report by either clicking on the pages listed below, or by using the keyword search tool below to find specific information within the annual report.-
 1
1 -
2
-
3
-
4
-
5
-
6
-
7
-
8
-
9
-
10
-
11
-
12
-
13
-
14
-
15
-
16
-
17
-
18
-
19
-
20
-
21
-
22
-
23
-
24
-
25
-
26
-
27
-
28
-
29
-
30
-
31
-
32
-
33
-
34
-
35
-
36
-
37
-
38
-
39
-
40
-
41
-
42
-
43
-
44
-
45
-
46
-
47
-
48
-
49
-
50
-
51
-
52
-
53
-
54
-
55
-
56
-
57
-
58
-
59
-
60
-
61
-
62
-
63
-
64
-
65
-
66
-
67
-
68
-
69
-
70
-
71
-
72
-
73
-
74
-
75
-
76
-
77
-
78
-
79
-
80
-
81
-
82
-
83
-
84
-
85
-
86
-
87
-
88
-
89
-
90
-
91
-
92
-
93
-
94
-
95
-
96
-
97
-
98
-
99
-
100
-
101
-
102
-
103
-
104
-
105
-
106
-
107
-
108
-
109
-
110
-
111
-
112
-
113
-
114
-
115
-
116
-
117
-
118
-
119
-
120
-
121
-
122
-
123
-
124
-
125
-
126
-
127
-
128
-
129
-
130
-
131
-
132
-
133
-
134
-
135
-
136
-
137
-
138
-
139
-
140
-
141
-
142
-
143
-
144
-
145
-
146
-
147
-
148
-
149
-
150
-
151
-
152
-
153
-
154
-
155
-
156
-
157
-
158
-
159
-
160
-
161
-
162
-
163
-
164
-
165
-
166
-
167
-
168
-
169
-
170
-
171
-
172
-
173
-
 174
174 -
 175
175 -
 176
176 -
 177
177 -
 178
178 -
 179
179 -
 180
180 -
 181
181 -
 182
182 -
 183
183 -
 184
184 -
 185
185 -
 186
186 -
 187
187 -
 188
188 -
 189
189 -
 190
190 -
 191
191 -
 192
192 -
 193
193 -
 194
194 -
195
-
196
-
197
-
198
-
199
-
200
-
201
-
202
-
203
-
204
-
205
-
206
-
207
-
208
-
209
-
210
-
211
-
212
-
213
-
214
-
215
-
216
-
217
-
218
-
219
-
220
-
221
-
222
-
223
-
224
-
225
-
226
-
227
-
228
-
229
-
230
-
231
-
232
 |
 |
TYCO INTERNATIONAL LTD.
NOTES TO CONSOLIDATED FINANCIAL STATEMENTS
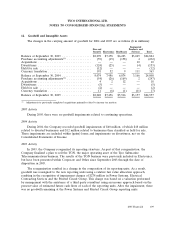
10. Sale of Accounts Receivable (Continued)
Company retained the risk of credit loss on the receivables and, accordingly, the full amount of the
reserve was retained on the Consolidated Balance Sheets. The proceeds from the sales were used to
repay short-term and long-term borrowings and for working capital and other corporate purposes and
were reported as operating cash flows in the Consolidated Statements of Cash Flows. The sale
proceeds were less than the face amount of accounts receivable sold by an amount that approximated
the cost that would have been incurred if commercial paper had been issued backed by these accounts
receivable. The discount from the face amount is accounted for as a loss on the sale of receivables and
has been included in selling, general and administrative expenses in the Consolidated Statements of
Income. Such discount aggregated $18 million and $29 million, or 3.1% and 3.5% of the weighted-
average balance of the receivables outstanding, during 2004 and 2003, respectively. The Company
retained collection and administrative responsibilities for the participating interests in the defined pool.
During 2004, the Company reduced outstanding balances under its accounts receivable programs
by $929 million, of which $812 million related to three of its corporate accounts receivable programs
which were terminated in 2005. No amounts were utilized under these programs at September 30, 2004,
and through the date of termination. The remaining reduction of $117 million related to certain of the
Company’s international businesses selling fewer accounts receivable as a short-term financing
mechanism. These transactions qualify as true sales. The aggregate amount outstanding under
international accounts receivable programs was $80 million and $99 million at September 30, 2005 and
2004, respectively.
11. Investments
At September 30, 2005 and 2004, Tyco had available-for-sale investments with a fair market value
of $265 million and $62 million and a cost basis of $268 million and $65 million, respectively. These
investments consist primarily of debt securities and are included in prepaid expenses and other current
assets and other assets within the Consolidated Balance Sheets. As of September 30, 2005, there were
unrealized losses of $9 million and unrealized gains of $6 million associated with these investments. At
September 30, 2004, there were unrealized losses of $2 million and unrealized gains of $5 million
associated with these investments. The unrealized gains and losses have been included as a separate
component of shareholders’ equity.
At September 30, 2005 and 2004, Tyco had held-to-maturity investments with a fair value of $4
million and $19 million, respectively. These investments are included in other assets within the
Consolidated Balance Sheets.
108 2005 Financials