ADT 2005 Annual Report Download - page 214
Download and view the complete annual report
Please find page 214 of the 2005 ADT annual report below. You can navigate through the pages in the report by either clicking on the pages listed below, or by using the keyword search tool below to find specific information within the annual report.-
 1
1 -
2
-
3
-
4
-
5
-
6
-
7
-
8
-
9
-
10
-
11
-
12
-
13
-
14
-
15
-
16
-
17
-
18
-
19
-
20
-
21
-
22
-
23
-
24
-
25
-
26
-
27
-
28
-
29
-
30
-
31
-
32
-
33
-
34
-
35
-
36
-
37
-
38
-
39
-
40
-
41
-
42
-
43
-
44
-
45
-
46
-
47
-
48
-
49
-
50
-
51
-
52
-
53
-
54
-
55
-
56
-
57
-
58
-
59
-
60
-
61
-
62
-
63
-
64
-
65
-
66
-
67
-
68
-
69
-
70
-
71
-
72
-
73
-
74
-
75
-
76
-
77
-
78
-
79
-
80
-
81
-
82
-
83
-
84
-
85
-
86
-
87
-
88
-
89
-
90
-
91
-
92
-
93
-
94
-
95
-
96
-
97
-
98
-
99
-
100
-
101
-
102
-
103
-
104
-
105
-
106
-
107
-
108
-
109
-
110
-
111
-
112
-
113
-
114
-
115
-
116
-
117
-
118
-
119
-
120
-
121
-
122
-
123
-
124
-
125
-
126
-
127
-
128
-
129
-
130
-
131
-
132
-
133
-
134
-
135
-
136
-
137
-
138
-
139
-
140
-
141
-
142
-
143
-
144
-
145
-
146
-
147
-
148
-
149
-
150
-
151
-
152
-
153
-
154
-
155
-
156
-
157
-
158
-
159
-
160
-
161
-
162
-
163
-
164
-
165
-
166
-
167
-
168
-
169
-
170
-
171
-
172
-
173
-
174
-
175
-
176
-
177
-
178
-
179
-
180
-
181
-
182
-
183
-
184
-
185
-
186
-
187
-
188
-
189
-
190
-
191
-
192
-
193
-
194
-
195
-
196
-
197
-
198
-
199
-
200
-
201
-
202
-
203
-
 204
204 -
 205
205 -
 206
206 -
 207
207 -
 208
208 -
 209
209 -
 210
210 -
 211
211 -
 212
212 -
 213
213 -
 214
214 -
 215
215 -
 216
216 -
 217
217 -
 218
218 -
 219
219 -
 220
220 -
 221
221 -
 222
222 -
 223
223 -
 224
224 -
225
-
226
-
227
-
228
-
229
-
230
-
231
-
232
 |
 |

TYCO INTERNATIONAL LTD.
NOTES TO CONSOLIDATED FINANCIAL STATEMENTS
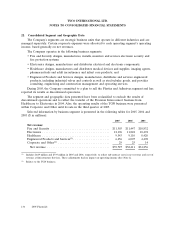
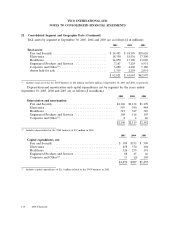
22. Consolidated Segment and Geographic Data (Continued)
Total assets by segment at September 30, 2005, 2004 and 2003 are as follows ($ in millions):
2005 2004 2003
Total assets:
Fire and Security ............................... $ 18,455 $ 18,199 $18,626
Electronics .................................... 18,350 18,536 17,100
Healthcare .................................... 14,050 13,190 13,069
Engineered Products and Services ................... 7,167 7,124 6,931
Corporate and Other(1) ........................... 3,280 4,460 5,180
Assets held for sale ............................. 1,319 2,158 2,091
$ 62,621 $ 63,667 $62,997
(1) Includes total assets for the TGN business of $48 million and $642 million at September 30, 2004 and 2003, respectively.
Depreciation and amortization and capital expenditures, net by segment for the years ended
September 30, 2005, 2004 and 2003 are as follows ($ in millions):
2005 2004 2003
Depreciation and amortization:
Fire and Security ................................... $1,106 $1,132 $1,199
Electronics ........................................ 559 540 484
Healthcare ........................................ 319 327 310
Engineered Products and Services ....................... 108 116 103
Corporate and Other(1) ............................... 8 4 46
$2,100 $2,119 $2,142
(1) Includes depreciation for the TGN business of $37 million in 2003.
2005 2004 2003
Capital expenditures, net:
Fire and Security .................................... $ 389 $335 $ 509
Electronics ......................................... 458 370 404
Healthcare ......................................... 326 239 191
Engineered Products and Services ........................ 88 45 46
Corporate and Other(1) ................................ 11 (2) 105
$1,272 $987 $1,255
(1) Includes capital expenditures of $113 million related to the TGN business in 2003.
138 2005 Financials