ADT 2005 Annual Report Download - page 213
Download and view the complete annual report
Please find page 213 of the 2005 ADT annual report below. You can navigate through the pages in the report by either clicking on the pages listed below, or by using the keyword search tool below to find specific information within the annual report.-
 1
1 -
2
-
3
-
4
-
5
-
6
-
7
-
8
-
9
-
10
-
11
-
12
-
13
-
14
-
15
-
16
-
17
-
18
-
19
-
20
-
21
-
22
-
23
-
24
-
25
-
26
-
27
-
28
-
29
-
30
-
31
-
32
-
33
-
34
-
35
-
36
-
37
-
38
-
39
-
40
-
41
-
42
-
43
-
44
-
45
-
46
-
47
-
48
-
49
-
50
-
51
-
52
-
53
-
54
-
55
-
56
-
57
-
58
-
59
-
60
-
61
-
62
-
63
-
64
-
65
-
66
-
67
-
68
-
69
-
70
-
71
-
72
-
73
-
74
-
75
-
76
-
77
-
78
-
79
-
80
-
81
-
82
-
83
-
84
-
85
-
86
-
87
-
88
-
89
-
90
-
91
-
92
-
93
-
94
-
95
-
96
-
97
-
98
-
99
-
100
-
101
-
102
-
103
-
104
-
105
-
106
-
107
-
108
-
109
-
110
-
111
-
112
-
113
-
114
-
115
-
116
-
117
-
118
-
119
-
120
-
121
-
122
-
123
-
124
-
125
-
126
-
127
-
128
-
129
-
130
-
131
-
132
-
133
-
134
-
135
-
136
-
137
-
138
-
139
-
140
-
141
-
142
-
143
-
144
-
145
-
146
-
147
-
148
-
149
-
150
-
151
-
152
-
153
-
154
-
155
-
156
-
157
-
158
-
159
-
160
-
161
-
162
-
163
-
164
-
165
-
166
-
167
-
168
-
169
-
170
-
171
-
172
-
173
-
174
-
175
-
176
-
177
-
178
-
179
-
180
-
181
-
182
-
183
-
184
-
185
-
186
-
187
-
188
-
189
-
190
-
191
-
192
-
193
-
194
-
195
-
196
-
197
-
198
-
199
-
200
-
201
-
202
-
 203
203 -
 204
204 -
 205
205 -
 206
206 -
 207
207 -
 208
208 -
 209
209 -
 210
210 -
 211
211 -
 212
212 -
 213
213 -
 214
214 -
 215
215 -
 216
216 -
 217
217 -
 218
218 -
 219
219 -
 220
220 -
 221
221 -
 222
222 -
 223
223 -
224
-
225
-
226
-
227
-
228
-
229
-
230
-
231
-
232
 |
 |

TYCO INTERNATIONAL LTD.
NOTES TO CONSOLIDATED FINANCIAL STATEMENTS
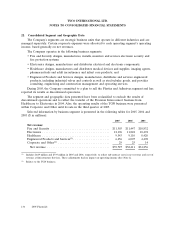
22. Consolidated Segment and Geographic Data (Continued)
2005 2004 2003
Operating income:
Fire and Security ..................................... $1,216 $ 899 $ 342
Electronics ......................................... 1,852 1,749 1,241
Healthcare ......................................... 2,286 2,365 2,104
Engineered Products and Services ......................... 672 620 362
Corporate and Other(1) ................................. (231) (397) (1,172)
$5,795 $5,236 $2,877
(1) Includes gain on sale of the TGN of $303 million in 2005. In addition, includes TGN operating loss of $54 million,
$73 million and $760 million in 2005, 2004 and 2003, respectively, prior to the disposition. Also includes general overhead
expenses previously allocated to the Plastics and Adhesives segment of $12 million in 2005 and 2004 and $11 million in 2003.
Net revenue by groups of products within Tyco’s segments for 2005, 2004 and 2003 is as follows ($
in millions):
2005 2004 2003
Net revenue by groups of products:
Electronic Security Services .......................... $ 6,824 $ 6,760 $ 6,345
Fire Protection Contracting and Services ................ 4,679 4,687 4,487
Fire and Security ................................ 11,503 11,447 10,832
Electronic Components ............................. 10,203 9,476 8,244
Wireless ........................................ 870 835 771
Electrical Contracting Services ........................ — 353 370
Power Systems ................................... 447 492 568
Printed Circuit Group .............................. 422 460 403
Submarine Telecommunications ....................... 254 206 136
Electronics .................................... 12,196 11,822 10,492
Medical Devices & Supplies ......................... 7,549 7,124 6,543
Retail ......................................... 830 912 904
Pharmaceuticals .................................. 1,164 1,074 973
Healthcare .................................... 9,543 9,110 8,420
Flow Control and Fire & Building Products .............. 3,418 3,037 2,717
Electrical & Metal Products ......................... 1,745 1,545 1,163
Infrastructure Services(1) ............................ 1,293 1,425 618
Engineered Products and Services ................... 6,456 6,007 4,498
Corporate and Other(2) ............................. 29 25 14
Net revenue ................................... $ 39,727 $38,411 $34,256
(1) Includes $649 million and $739 million in 2005 and 2004, respectively, to reflect sub-contract costs in net revenue and cost of
revenue at Infrastructure Services. These adjustments had no impact on operating income (See Note 1).
(2) Net revenue relates to the TGN business.
2005 Financials 137