ADT 2005 Annual Report Download - page 117
Download and view the complete annual report
Please find page 117 of the 2005 ADT annual report below. You can navigate through the pages in the report by either clicking on the pages listed below, or by using the keyword search tool below to find specific information within the annual report.-
 1
1 -
2
-
3
-
4
-
5
-
6
-
7
-
8
-
9
-
10
-
11
-
12
-
13
-
14
-
15
-
16
-
17
-
18
-
19
-
20
-
21
-
22
-
23
-
24
-
25
-
26
-
27
-
28
-
29
-
30
-
31
-
32
-
33
-
34
-
35
-
36
-
37
-
38
-
39
-
40
-
41
-
42
-
43
-
44
-
45
-
46
-
47
-
48
-
49
-
50
-
51
-
52
-
53
-
54
-
55
-
56
-
57
-
58
-
59
-
60
-
61
-
62
-
63
-
64
-
65
-
66
-
67
-
68
-
69
-
70
-
71
-
72
-
73
-
74
-
75
-
76
-
77
-
78
-
79
-
80
-
81
-
82
-
83
-
84
-
85
-
86
-
87
-
88
-
89
-
90
-
91
-
92
-
93
-
94
-
95
-
96
-
97
-
98
-
99
-
100
-
101
-
102
-
103
-
104
-
105
-
106
-
 107
107 -
 108
108 -
 109
109 -
 110
110 -
 111
111 -
 112
112 -
 113
113 -
 114
114 -
 115
115 -
 116
116 -
 117
117 -
 118
118 -
 119
119 -
 120
120 -
 121
121 -
 122
122 -
 123
123 -
 124
124 -
 125
125 -
 126
126 -
 127
127 -
128
-
129
-
130
-
131
-
132
-
133
-
134
-
135
-
136
-
137
-
138
-
139
-
140
-
141
-
142
-
143
-
144
-
145
-
146
-
147
-
148
-
149
-
150
-
151
-
152
-
153
-
154
-
155
-
156
-
157
-
158
-
159
-
160
-
161
-
162
-
163
-
164
-
165
-
166
-
167
-
168
-
169
-
170
-
171
-
172
-
173
-
174
-
175
-
176
-
177
-
178
-
179
-
180
-
181
-
182
-
183
-
184
-
185
-
186
-
187
-
188
-
189
-
190
-
191
-
192
-
193
-
194
-
195
-
196
-
197
-
198
-
199
-
200
-
201
-
202
-
203
-
204
-
205
-
206
-
207
-
208
-
209
-
210
-
211
-
212
-
213
-
214
-
215
-
216
-
217
-
218
-
219
-
220
-
221
-
222
-
223
-
224
-
225
-
226
-
227
-
228
-
229
-
230
-
231
-
232
 |
 |

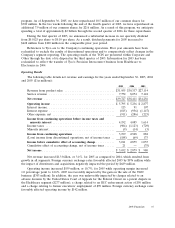
Engineered Products and Services
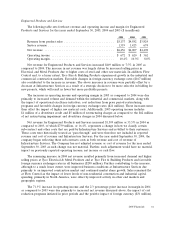
The following table sets forth net revenue and operating income and margin for Engineered
Products and Services for the years ended September 30, 2005, 2004 and 2003 ($ in millions):
2005 2004 2003
Revenue from product sales ............................. $5,137 $4,582 $3,824
Service revenue ...................................... 1,319 1,425 674
Net revenue ........................................ $6,456 $6,007 $4,498
Operating income .................................... $ 672 $ 620 $ 362
Operating margin ..................................... 10.4% 10.3% 8.0%
Net revenue for Engineered Products and Services increased $449 million or 7.5% in 2005 as
compared to 2004. The increase in net revenue was largely driven by increased selling prices in
Electrical and Metal Products due to higher costs of steel and other raw materials. In addition, Flow
Control and, to a lesser extent, Tyco Fire & Building Products experienced growth in the industrial and
commercial construction markets. Favorable changes in foreign currency exchange rates ($167 million)
also contributed to the increase in revenue. The above increases in revenue were partially offset by a
decrease at Infrastructure Services as a result of a strategic decision to be more selective in bidding for
new projects, which will result in fewer but more profitable projects.
The increases in operating income and operating margin in 2005 as compared to 2004 were due
primarily to increased volume and demand within the industrial and commercial markets, along with
the impact of operational excellence initiatives, cost reductions from prior period restructuring
programs and favorable changes in foreign currency exchange rates ($21 million). These increases more
than offset the impact of higher raw material costs. Additionally, 2005 operating income includes
$1 million of a divestiture credit and $5 million of restructuring charges as compared to the $62 million
of net restructuring impairment and divestiture charges in 2004 discussed below.
Net revenue for Engineered Products and Services increased $1,509 million or 33.5% in 2004 as
compared to 2003, of which $739 million, or 16.4%, represents a change in how we classify certain
sub-contract and other costs that are paid by Infrastructure Services and re-billed to their customers.
These costs were historically treated as ‘‘pass through’’ and were therefore not included in reported
revenue and cost of revenue and Infrastructure Services. For the year ended September 30, 2004, the
company began reflecting these sub-contracts costs in both revenue and cost of revenue of
Infrastructure Services. The Company has not adjusted revenue or cost of revenue for the year ended
September 30, 2003 as such change was not material. Further, such adjustment would have no material
impact on previously reported operating income, net income or cash flow.
The remaining increase in 2004 net revenue resulted primarily from increased demand and higher
selling prices at Tyco Electrical & Metal Products and at Tyco Fire & Building Products and favorable
foreign currency exchanges rates in all businesses ($298 million). Further contributing to the increase,
although to a much lesser extent, were improved business conditions at Infrastructure Services due
primarily to an improved construction market and continued market share growth. Sales remained flat
at Flow Control as the impact of lower levels of non-residential construction and industrial capital
spending, primarily in North America, were offset by improved activity in other end markets and
geographic regions.
The 71.3% increase in operating income and the 2.3 percentage point increase in margin in 2004
as compared to 2003 were due primarily to increased net revenue discussed above, the impact of cost
reduction programs initiated in prior periods and the positive impact of foreign currency ($31 million).
2005 Financials 41