ADT 2005 Annual Report Download - page 191
Download and view the complete annual report
Please find page 191 of the 2005 ADT annual report below. You can navigate through the pages in the report by either clicking on the pages listed below, or by using the keyword search tool below to find specific information within the annual report.-
 1
1 -
2
-
3
-
4
-
5
-
6
-
7
-
8
-
9
-
10
-
11
-
12
-
13
-
14
-
15
-
16
-
17
-
18
-
19
-
20
-
21
-
22
-
23
-
24
-
25
-
26
-
27
-
28
-
29
-
30
-
31
-
32
-
33
-
34
-
35
-
36
-
37
-
38
-
39
-
40
-
41
-
42
-
43
-
44
-
45
-
46
-
47
-
48
-
49
-
50
-
51
-
52
-
53
-
54
-
55
-
56
-
57
-
58
-
59
-
60
-
61
-
62
-
63
-
64
-
65
-
66
-
67
-
68
-
69
-
70
-
71
-
72
-
73
-
74
-
75
-
76
-
77
-
78
-
79
-
80
-
81
-
82
-
83
-
84
-
85
-
86
-
87
-
88
-
89
-
90
-
91
-
92
-
93
-
94
-
95
-
96
-
97
-
98
-
99
-
100
-
101
-
102
-
103
-
104
-
105
-
106
-
107
-
108
-
109
-
110
-
111
-
112
-
113
-
114
-
115
-
116
-
117
-
118
-
119
-
120
-
121
-
122
-
123
-
124
-
125
-
126
-
127
-
128
-
129
-
130
-
131
-
132
-
133
-
134
-
135
-
136
-
137
-
138
-
139
-
140
-
141
-
142
-
143
-
144
-
145
-
146
-
147
-
148
-
149
-
150
-
151
-
152
-
153
-
154
-
155
-
156
-
157
-
158
-
159
-
160
-
161
-
162
-
163
-
164
-
165
-
166
-
167
-
168
-
169
-
170
-
171
-
172
-
173
-
174
-
175
-
176
-
177
-
178
-
179
-
180
-
 181
181 -
 182
182 -
 183
183 -
 184
184 -
 185
185 -
 186
186 -
 187
187 -
 188
188 -
 189
189 -
 190
190 -
 191
191 -
 192
192 -
 193
193 -
 194
194 -
 195
195 -
 196
196 -
 197
197 -
 198
198 -
 199
199 -
 200
200 -
 201
201 -
202
-
203
-
204
-
205
-
206
-
207
-
208
-
209
-
210
-
211
-
212
-
213
-
214
-
215
-
216
-
217
-
218
-
219
-
220
-
221
-
222
-
223
-
224
-
225
-
226
-
227
-
228
-
229
-
230
-
231
-
232
 |
 |

TYCO INTERNATIONAL LTD.
NOTES TO CONSOLIDATED FINANCIAL STATEMENTS
14. Debt (Continued)
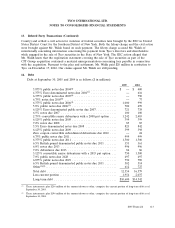
The weighted-average rate of interest on total debt was 5.6% and 5.2% for the year ended
September 30, 2005 and 2004, respectively, excluding the impact of interest rate swaps. The weighted-
average rate of interest on all variable debt was 7.2% and 6.2% at September 30, 2005 and 2004,
respectively. The impact of the Company’s interest rate swap agreements on reported interest expense
was a reduction of $40 million, $66 million and zero for 2005, 2004 and 2003, respectively.
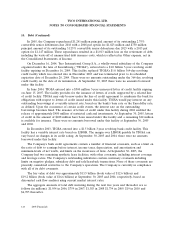
15. Guarantees
Certain of the Company’s business segments have guaranteed the performance of third-parties and
provided financial guarantees for uncompleted work and financial commitments. The terms of these
guarantees vary with end dates ranging from 2006 through the completion of such transactions. The
guarantees would be triggered in the event of nonperformance and the potential exposure for
nonperformance under the guarantees would not have a material effect on the Company’s financial
position, results of operations or cash flows.
In disposing of assets or businesses, the Company often provides representations, warranties and/or
indemnities to cover various risks including, for example, unknown damage to the assets, environmental
risks involved in the sale of real estate, liability to investigate and remediate environmental
contamination at waste disposal sites and manufacturing facilities, and unidentified tax liabilities and
legal fees related to periods prior to disposition. The Company does not have the ability to estimate
the potential liability from such indemnities because they relate to unknown conditions. However, the
Company has no reason to believe that these uncertainties would have a material adverse effect on the
Company’s financial position, annual results of operations or cash flows.
The Company has recorded liabilities for known indemnifications included as part of
environmental liabilities. See Note 17 for a discussion of these liabilities.
The Company has guaranteed the fair value of certain vessels not to exceed $235 million, and as of
September 30, 2005 expects the obligation to be $54 million, which is recorded in the accompanying
Consolidated Balance Sheet, based on its estimate of the fair value of the vessels (see Note 17).
In the normal course of business, the Company is liable for contract completion and product
performance. In the opinion of management, such obligations will not significantly affect the
Company’s financial position, results of operations or cash flows.
The Company generally records estimated product warranty costs at the time of sale. For further
information on estimated product warranty, see Note 1.
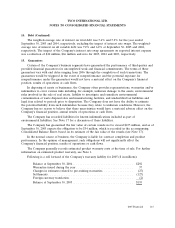
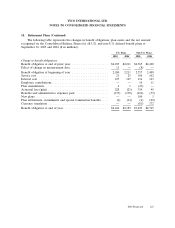
Following is a roll forward of the Company’s warranty liability for 2005 ($ in millions):
Balance at September 30, 2004 ................................... $292
Warranties issued during the year ................................. 57
Changes in estimates related to pre-existing warranties ................. (27)
Settlements ................................................. (127)
Foreign currency translation ..................................... (2)
Balance at September 30, 2005 ................................... $193
2005 Financials 115