ADT 2005 Annual Report Download - page 127
Download and view the complete annual report
Please find page 127 of the 2005 ADT annual report below. You can navigate through the pages in the report by either clicking on the pages listed below, or by using the keyword search tool below to find specific information within the annual report.-
 1
1 -
2
-
3
-
4
-
5
-
6
-
7
-
8
-
9
-
10
-
11
-
12
-
13
-
14
-
15
-
16
-
17
-
18
-
19
-
20
-
21
-
22
-
23
-
24
-
25
-
26
-
27
-
28
-
29
-
30
-
31
-
32
-
33
-
34
-
35
-
36
-
37
-
38
-
39
-
40
-
41
-
42
-
43
-
44
-
45
-
46
-
47
-
48
-
49
-
50
-
51
-
52
-
53
-
54
-
55
-
56
-
57
-
58
-
59
-
60
-
61
-
62
-
63
-
64
-
65
-
66
-
67
-
68
-
69
-
70
-
71
-
72
-
73
-
74
-
75
-
76
-
77
-
78
-
79
-
80
-
81
-
82
-
83
-
84
-
85
-
86
-
87
-
88
-
89
-
90
-
91
-
92
-
93
-
94
-
95
-
96
-
97
-
98
-
99
-
100
-
101
-
102
-
103
-
104
-
105
-
106
-
107
-
108
-
109
-
110
-
111
-
112
-
113
-
114
-
115
-
116
-
 117
117 -
 118
118 -
 119
119 -
 120
120 -
 121
121 -
 122
122 -
 123
123 -
 124
124 -
 125
125 -
 126
126 -
 127
127 -
 128
128 -
 129
129 -
 130
130 -
 131
131 -
 132
132 -
 133
133 -
 134
134 -
 135
135 -
 136
136 -
 137
137 -
138
-
139
-
140
-
141
-
142
-
143
-
144
-
145
-
146
-
147
-
148
-
149
-
150
-
151
-
152
-
153
-
154
-
155
-
156
-
157
-
158
-
159
-
160
-
161
-
162
-
163
-
164
-
165
-
166
-
167
-
168
-
169
-
170
-
171
-
172
-
173
-
174
-
175
-
176
-
177
-
178
-
179
-
180
-
181
-
182
-
183
-
184
-
185
-
186
-
187
-
188
-
189
-
190
-
191
-
192
-
193
-
194
-
195
-
196
-
197
-
198
-
199
-
200
-
201
-
202
-
203
-
204
-
205
-
206
-
207
-
208
-
209
-
210
-
211
-
212
-
213
-
214
-
215
-
216
-
217
-
218
-
219
-
220
-
221
-
222
-
223
-
224
-
225
-
226
-
227
-
228
-
229
-
230
-
231
-
232
 |
 |

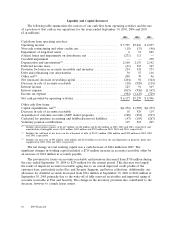
Cash flows from operating activities and other cash flow items by segment were as follows for the
year ended September 30, 2005 ($ in millions):
Engineered
Products Corporate
Fire and and and
Security Electronics Healthcare Services Other Total
Cash flows from operating activities:
Operating income (loss) ............. $1,216 $1,852 $2,286 $672 $ (231) $ 5,795
Restructuring, impairment and other
(credits) charges, net .............. — (11) 3 2 (6) (12)
Non-cash losses and impairments on
divestitures, net .................. 18 — 8 (1) (296) (271)
Depreciation .................... 582 491 262 104 8 1,447
Intangible assets amortization ........ 524 68 57 4 — 653
Depreciation and amortization ......... 1,106 559 319 108 8 2,100
Deferred income taxes .............. — — — — (41) (41)
Provision for losses on accounts receivable
and inventory ................... 71 84 41 38 — 234
Debt and refinancing cost amortization . . . — — — — 30 30
Net (increase) decrease in working capital
and other(1) .................... (277) (311) 236 (88) 436 (4)
Decrease in sale of accounts receivable . . . (8) (1) (9) — — (18)
Interest income ................... — — — — 123 123
Interest expense ................... — — — — (815) (815)
Income tax expense ................. — — — — (984) (984)
Net cash provided by operating activities . . $2,126 $2,172 $2,884 $731 $(1,776) $ 6,137
Other cash flow items:
Capital expenditures, net ............. $(389) $ (458) $ (326) $(88) $ (11) $(1,272)
Decrease in sale of accounts receivable . . . 8 1 9 — — 18
Acquisition of customer accounts (ADT
dealer program) ................. (328) — — — — (328)
Cash paid for purchase accounting and
holdback/earn-out liabilities .......... (10) (18) (14) (5) — (47)
Voluntary pension contributions ........ 82 25 8 — — 115
(1) Includes the add back of $1,013 million related to a loss on the retirement of debt.
During 2005, 2004 and 2003 we paid out $161 million, $228 million and $499 million, respectively,
in cash related to restructuring activities. See Note 2 to our Consolidated Financial Statements for
further information regarding our restructuring activities. We anticipate a cash outflow of approximately
$50 million in 2006 related to restructuring activities in our Electronics segment.
During 2005, 2004 and 2003, Tyco paid $328 million, $254 million and $597 million of cash,
respectively, to acquire 0.4 million, 0.3 million and 0.6 million customer contracts for electronic security
services through the ADT dealer program.
During 2005, 2004 and 2003, we paid $47 million, $105 million and $267 million, respectively, in
cash for purchase accounting and holdback/earn-out liabilities. Holdback liabilities represent a portion
of the purchase price that is withheld from the seller pending finalization of the acquisition balance
sheet. Certain acquisitions have provisions which require Tyco to make additional ‘‘earn-out’’ payments
to the sellers if the acquired company achieves certain milestones subsequent to its acquisition by Tyco.
These earn-out payments are tied to certain performance measures, such as revenue, gross margin or
earnings growth. At September 30, 2005 holdback/earn-out liabilities on our Consolidated Balance
2005 Financials 51