ADT 2005 Annual Report Download - page 202
Download and view the complete annual report
Please find page 202 of the 2005 ADT annual report below. You can navigate through the pages in the report by either clicking on the pages listed below, or by using the keyword search tool below to find specific information within the annual report.-
 1
1 -
2
-
3
-
4
-
5
-
6
-
7
-
8
-
9
-
10
-
11
-
12
-
13
-
14
-
15
-
16
-
17
-
18
-
19
-
20
-
21
-
22
-
23
-
24
-
25
-
26
-
27
-
28
-
29
-
30
-
31
-
32
-
33
-
34
-
35
-
36
-
37
-
38
-
39
-
40
-
41
-
42
-
43
-
44
-
45
-
46
-
47
-
48
-
49
-
50
-
51
-
52
-
53
-
54
-
55
-
56
-
57
-
58
-
59
-
60
-
61
-
62
-
63
-
64
-
65
-
66
-
67
-
68
-
69
-
70
-
71
-
72
-
73
-
74
-
75
-
76
-
77
-
78
-
79
-
80
-
81
-
82
-
83
-
84
-
85
-
86
-
87
-
88
-
89
-
90
-
91
-
92
-
93
-
94
-
95
-
96
-
97
-
98
-
99
-
100
-
101
-
102
-
103
-
104
-
105
-
106
-
107
-
108
-
109
-
110
-
111
-
112
-
113
-
114
-
115
-
116
-
117
-
118
-
119
-
120
-
121
-
122
-
123
-
124
-
125
-
126
-
127
-
128
-
129
-
130
-
131
-
132
-
133
-
134
-
135
-
136
-
137
-
138
-
139
-
140
-
141
-
142
-
143
-
144
-
145
-
146
-
147
-
148
-
149
-
150
-
151
-
152
-
153
-
154
-
155
-
156
-
157
-
158
-
159
-
160
-
161
-
162
-
163
-
164
-
165
-
166
-
167
-
168
-
169
-
170
-
171
-
172
-
173
-
174
-
175
-
176
-
177
-
178
-
179
-
180
-
181
-
182
-
183
-
184
-
185
-
186
-
187
-
188
-
189
-
190
-
191
-
 192
192 -
 193
193 -
 194
194 -
 195
195 -
 196
196 -
 197
197 -
 198
198 -
 199
199 -
 200
200 -
 201
201 -
 202
202 -
 203
203 -
 204
204 -
 205
205 -
 206
206 -
 207
207 -
 208
208 -
 209
209 -
 210
210 -
 211
211 -
 212
212 -
213
-
214
-
215
-
216
-
217
-
218
-
219
-
220
-
221
-
222
-
223
-
224
-
225
-
226
-
227
-
228
-
229
-
230
-
231
-
232
 |
 |

TYCO INTERNATIONAL LTD.
NOTES TO CONSOLIDATED FINANCIAL STATEMENTS
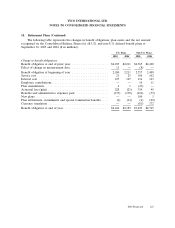
18. Retirement Plans (Continued)
U.S. Plans Non-U.S. Plans
2005 2004 2005 2004
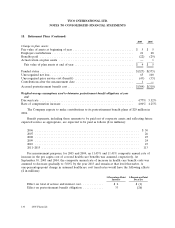
Change in plan assets:
Fair value of plan assets at end of prior year ................ $1,966 $1,483 $ 1,588 $ 1,259
Effect of change in measurement date .................... (338) — (33) —
Fair value of plan assets at beginning of year ............... 1,628 1,483 1,555 1,259
Actual return on plan assets ............................ 245 128 260 137
Employer contributions ............................... 366 502 205 184
Employee contributions ............................... — — 11 11
New plans ......................................... — — 82 1
Plan settlements, curtailments and special termination benefits . . . (1) (9) (8) (23)
Benefits and administrative expenses paid .................. (137) (138) (104) (79)
Currency translation ................................. — — (52) 98
Fair value of plan assets at end of year .................. $2,101 $1,966 $ 1,949 $ 1,588
Funded status ...................................... $(341) $ (223) $(1,280) $(1,177)
Unrecognized net actuarial loss ......................... 773 648 1,011 856
Unrecognized prior service cost ......................... 26 27 (36) 4
Unrecognized transition asset ........................... — — (6) (6)
Contributions after the measurement date .................. 1 — 10 —
Net amount recognized ............................. $ 459 $ 452 $ (301) $ (323)
Amounts recognized on the Consolidated Balance Sheets:
Prepaid benefit cost .................................. $ — $ 4 $ 27 $ 99
Accrued benefit liability ............................... (333) (216) (974) (913)
Intangible asset ..................................... 22 16 5 5
Accumulated other comprehensive income ................. 770 648 641 486
Net amount recognized ............................. $ 459 $ 452 $ (301) $ (323)
Weighted-average assumptions used to determine pension benefit
obligations at year end:
Discount rate ........................................ 5.25% 6.00% 4.26% 4.90%
Rate of compensation increase ............................ 4.00% 4.25% 3.43% 3.61%
In determining the expected return on plan assets, the Company considers the relative weighting of
plan assets by class and individual asset class performance expectations as provided by its external
advisors.
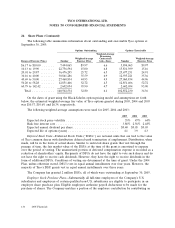
The Company’s investment strategy for its pension plans is to manage the plans on a going-
concern basis. Current investment policy is to achieve a superior return on assets, subject to a prudent
level of portfolio risk, for the purpose of enhancing the security of benefits for participants. For U.S.
pension plans, this policy targets a 60% allocation to equity securities and a 40% allocation to debt
securities. Various asset allocation strategies are in place for non-U.S. pension plans, with a weighted-
average target allocation of 54% to equity securities, 40% to debt securities and 6% to other asset
classes, including real estate and cash equivalents.
126 2005 Financials