ADT 2005 Annual Report Download - page 108
Download and view the complete annual report
Please find page 108 of the 2005 ADT annual report below. You can navigate through the pages in the report by either clicking on the pages listed below, or by using the keyword search tool below to find specific information within the annual report.-
 1
1 -
2
-
3
-
4
-
5
-
6
-
7
-
8
-
9
-
10
-
11
-
12
-
13
-
14
-
15
-
16
-
17
-
18
-
19
-
20
-
21
-
22
-
23
-
24
-
25
-
26
-
27
-
28
-
29
-
30
-
31
-
32
-
33
-
34
-
35
-
36
-
37
-
38
-
39
-
40
-
41
-
42
-
43
-
44
-
45
-
46
-
47
-
48
-
49
-
50
-
51
-
52
-
53
-
54
-
55
-
56
-
57
-
58
-
59
-
60
-
61
-
62
-
63
-
64
-
65
-
66
-
67
-
68
-
69
-
70
-
71
-
72
-
73
-
74
-
75
-
76
-
77
-
78
-
79
-
80
-
81
-
82
-
83
-
84
-
85
-
86
-
87
-
88
-
89
-
90
-
91
-
92
-
93
-
94
-
95
-
96
-
97
-
 98
98 -
 99
99 -
 100
100 -
 101
101 -
 102
102 -
 103
103 -
 104
104 -
 105
105 -
 106
106 -
 107
107 -
 108
108 -
 109
109 -
 110
110 -
 111
111 -
 112
112 -
 113
113 -
 114
114 -
 115
115 -
 116
116 -
 117
117 -
 118
118 -
119
-
120
-
121
-
122
-
123
-
124
-
125
-
126
-
127
-
128
-
129
-
130
-
131
-
132
-
133
-
134
-
135
-
136
-
137
-
138
-
139
-
140
-
141
-
142
-
143
-
144
-
145
-
146
-
147
-
148
-
149
-
150
-
151
-
152
-
153
-
154
-
155
-
156
-
157
-
158
-
159
-
160
-
161
-
162
-
163
-
164
-
165
-
166
-
167
-
168
-
169
-
170
-
171
-
172
-
173
-
174
-
175
-
176
-
177
-
178
-
179
-
180
-
181
-
182
-
183
-
184
-
185
-
186
-
187
-
188
-
189
-
190
-
191
-
192
-
193
-
194
-
195
-
196
-
197
-
198
-
199
-
200
-
201
-
202
-
203
-
204
-
205
-
206
-
207
-
208
-
209
-
210
-
211
-
212
-
213
-
214
-
215
-
216
-
217
-
218
-
219
-
220
-
221
-
222
-
223
-
224
-
225
-
226
-
227
-
228
-
229
-
230
-
231
-
232
 |
 |

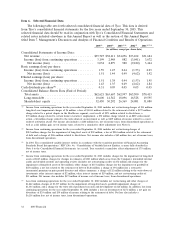
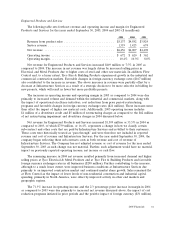
Item 6. Selected Financial Data
The following table sets forth selected consolidated financial data of Tyco. This data is derived
from Tyco’s consolidated financial statements for the five years ended September 30, 2005. This
selected financial data should be read in conjunction with Tyco’s Consolidated Financial Statements and
related notes included elsewhere in this Annual Report as well as the section of this Annual Report
titled Item 7. Management’s Discussion and Analysis of Financial Condition and Results of Operations.
2005(1) 2004(2) 2003(3)(4) 2002(5) 2001(6)(7)(8)
(in millions, except per share data)
Consolidated Statements of Income Data:
Net revenue .............................. $39,727 $38,411 $34,256 $33,102 $31,684
Income (loss) from continuing operations ......... 3,199 2,948 882 (3,041) 3,672
Net income (loss) ........................ 3,032 2,879 980 (9,180) 3,464
Basic earnings (loss) per share:
Income (loss) from continuing operations ......... 1.59 1.47 0.44 (1.53) 2.03
Net income (loss) ........................ 1.51 1.44 0.49 (4.62) 1.92
Diluted earnings (loss) per share:
Income (loss) from continuing operations ......... 1.51 1.38 0.44 (1.53) 1.95
Net income (loss) ........................ 1.43 1.35 0.49 (4.62) 1.84
Cash dividends per share(9) ..................... 0.31 0.05 0.05 0.05 0.05
Consolidated Balance Sheets Data (End of Period):
Total assets ............................... $62,621 $63,667 $62,997 $65,500 $70,413
Long-term debt ............................ 10,600 14,542 18,096 16,528 19,595
Shareholders’ equity ........................ 32,450 30,292 26,369 24,081 31,080
(1) Income from continuing operations for the year ended September 30, 2005 includes net restructuring charges of $11 million,
long-lived asset impairment charges of $6 million, a loss of $1,013 million related to the retirement of debt, a $277 million
charge related to a patent dispute in the Healthcare segment, a net credit of $271 million related to divestitures, a
$70 million charge related to certain former executives’ employment, a $50 million charge related to an SEC enforcement
action, a $4 million charge related to the write-down of an investment as well as $109 million of income related to a court-
ordered restitution award. Net income also includes a $188 million loss, net of income taxes, from discontinued operations as
well as a $21 million gain, net of income taxes, related to a cumulative effect adjustment (see Note 8).
(2) Income from continuing operations for the year ended September 30, 2004 includes net restructuring charges of
$212 million, charges for the impairment of long-lived assets of $52 million, a loss of $284 million related to the retirement
of debt and a charge of $116 million related to divestitures. Net income also includes a $69 million loss, net of income taxes,
from discontinued operations.
(3) In 2003, Tyco consolidated variable interest entities in accordance with the transition provisions of Financial Accounting
Standards Board Interpretation (‘‘FIN’’) No. 46, ‘‘Consolidation of Variable Interest Entities, as more fully described in
Note 8 to the Consolidated Financial Statements. As a result, Tyco recorded a cumulative effect adjustment of $75 million,
net of income taxes.
(4) Income from continuing operations for the year ended September 30, 2003 includes charges for the impairment of long-lived
assets of $815 million, charges for changes in estimates of $383 million which arose from the Company’s intensified internal
audits and detailed controls and operating reviews (includes net restructuring credits of $72 million and charges for the
impairment of long-lived assets of $10 million), other charges of $154 million, charges for the impairment of goodwill of
$278 million, a net loss related to the retirement of debt of $128 million, a charge of $91 million for a retroactive
incremental premium on prior period directors and officers insurance, a charge of $12 million relating to the write-down of
investments, other interest expense of $2 million, other interest income of $19 million, and net restructuring credits of
$11 million. Net income also includes $173 million of income, net of income taxes, from discontinued operations.
(5) Loss from continuing operations for the year ended September 30, 2002 includes net restructuring and other charges of
$1,862 million, charges of $3,307 million for the impairment of long-lived assets, goodwill impairment charges of
$1,344 million, and a charge for the write-off of purchased research and development of $18 million. In addition, loss from
continuing operations for the year ended September 30, 2002 includes a loss on investments of $271 million, a net gain on
divestiture of $24 million and $30 million of income relating to the retirement of debt. Net loss also includes a
$6,138 million loss, net of income taxes, from discontinued operations.
32 2005 Financials