ADT 2005 Annual Report Download - page 230
Download and view the complete annual report
Please find page 230 of the 2005 ADT annual report below. You can navigate through the pages in the report by either clicking on the pages listed below, or by using the keyword search tool below to find specific information within the annual report.-
 1
1 -
2
-
3
-
4
-
5
-
6
-
7
-
8
-
9
-
10
-
11
-
12
-
13
-
14
-
15
-
16
-
17
-
18
-
19
-
20
-
21
-
22
-
23
-
24
-
25
-
26
-
27
-
28
-
29
-
30
-
31
-
32
-
33
-
34
-
35
-
36
-
37
-
38
-
39
-
40
-
41
-
42
-
43
-
44
-
45
-
46
-
47
-
48
-
49
-
50
-
51
-
52
-
53
-
54
-
55
-
56
-
57
-
58
-
59
-
60
-
61
-
62
-
63
-
64
-
65
-
66
-
67
-
68
-
69
-
70
-
71
-
72
-
73
-
74
-
75
-
76
-
77
-
78
-
79
-
80
-
81
-
82
-
83
-
84
-
85
-
86
-
87
-
88
-
89
-
90
-
91
-
92
-
93
-
94
-
95
-
96
-
97
-
98
-
99
-
100
-
101
-
102
-
103
-
104
-
105
-
106
-
107
-
108
-
109
-
110
-
111
-
112
-
113
-
114
-
115
-
116
-
117
-
118
-
119
-
120
-
121
-
122
-
123
-
124
-
125
-
126
-
127
-
128
-
129
-
130
-
131
-
132
-
133
-
134
-
135
-
136
-
137
-
138
-
139
-
140
-
141
-
142
-
143
-
144
-
145
-
146
-
147
-
148
-
149
-
150
-
151
-
152
-
153
-
154
-
155
-
156
-
157
-
158
-
159
-
160
-
161
-
162
-
163
-
164
-
165
-
166
-
167
-
168
-
169
-
170
-
171
-
172
-
173
-
174
-
175
-
176
-
177
-
178
-
179
-
180
-
181
-
182
-
183
-
184
-
185
-
186
-
187
-
188
-
189
-
190
-
191
-
192
-
193
-
194
-
195
-
196
-
197
-
198
-
199
-
200
-
201
-
202
-
203
-
204
-
205
-
206
-
207
-
208
-
209
-
210
-
211
-
212
-
213
-
214
-
215
-
216
-
217
-
218
-
219
-
 220
220 -
 221
221 -
 222
222 -
 223
223 -
 224
224 -
 225
225 -
 226
226 -
 227
227 -
 228
228 -
 229
229 -
 230
230 -
 231
231 -
 232
232
 |
 |

SENIOR MANAgEMENT TEAM
BOARD OF DIRECTO R S
REgISTERED & PRINCIPAL EXECUTIVE OFFICE
INDEPENDENT AUDITORS
ShAREhOLDER SERVICES STOCk EXChANgES
TyCO ON ThE INTERNET
TRADEMARkS
CORPORATE DATA
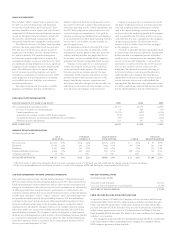
NON-gAAP MEASURES
FREE CASh FLOw RECONCILIATION
RECONCILIATION TO “FREE CASH FLOW”: 2005 2004 2003
Net cash provided by operating activities $6,137 $5,279 $4,996
Decrease in accounts receivable programs 18 929 119
Capital expenditures, net (1,272) (987) (1,255)
Acquisition of customer accounts (ADT dealer program) (328) (254) (597)
Cash paid for purchase accounting and holdback/earn-out liabilities (47) (105) (267)
Voluntary pension contributions 115 567 205
FREE CASH FLOW $4,623 $5,429 $3,201
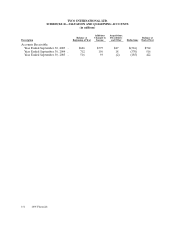
ORgANIC gROw Th RECONCILIATI O N
(Year Ended September 30, 2005)
NET FOREIGN ACQUISITION/ ORGANIC
REVENUES CURRENCY DIVESTITURE OTHER REVENUE GROWTH
Fire & Security $11,503 0.5% $274 2.4% $(315) -2.8% $ — 0.0% $ 97 0.9%
Electronics 12,196 3.2% 294 2.5% (346) -3.0% 39(1) 0.3% 387 3.4%
Healthcare 9,543 4.8% 141 1.5% (18) -0.1% — 0.0% 310 3.4%
Engineered Products & Services 6,456 7.5% 167 2.8% (14) -0.3% (18)(2) -0.3% 314 5.3%
Corporate and Other 29 NM — NM 4 NM — NM — NM
TOTAL NET REVENUES $39,727 3.4% $876 2.3% $(689) -1.9% $ 21 0.1% $1,108 2.9%
(1) Effective October 1, 2004, Tyco changed its fiscal year from a calendar year to a 52/53-week year and conformed the closing periods of certain subsidiaries.
(2) Reflects the deconsolidation of several joint ventures as a result of the adoption of FIN 46R during the second quarter of fiscal 2004.
“Free cash flow” (FCF), “organic revenue growth,” and
“net debt” are non-GAAP measures and should not
be considered replacements for GAAP results. These
measures should be used in conjunction with the most
comparable GAAP financial measures. Investors are urged
to read the Company’s financial statements as filed with
the Securities and Exchange Commission for more
information about the most comparable GAAP measures.
The difference between Cash Flows from Operating
Activities (the most comparable GAAP measure) and
FCF (the non-GAAP measure) consists mainly of
significant cash outflows that the company believes
are useful to identify. FCF permits management
and investors to gain insight into the number that
management employs to measure cash that is free from
any significant existing obligation. It is also a significant
component in the company’s incentive compensation
plans. The difference reflects the impact from: the
sale of accounts receivable programs, net capital
expenditures, acquisition of customer accounts (ADT
dealer program), cash paid for purchase accounting
and holdback/earn-out liabilities, and voluntary
pension contributions.
The impact from the sale of accounts receivable
programs and voluntary pension contributions is
added or subtracted from the GAAP measure because
this activity is driven by economic financing decisions
rather than operating activity. Capital expenditures and
the ADT dealer program are subtracted because they
represent long-term commitments. Cash paid for
purchase accounting and holdback/earn-out liabilities
is subtracted from Cash Flow from Operating Activities
because these cash outflows are not available for
general corporate uses.
The limitation associated with using FCF is that
it subtracts cash items that are ultimately within
management’s and the Board of Directors’ discretion
to direct and that therefore may imply that there is
less or more cash that is available for the company’s
programs than the most comparable GAAP measure.
“Organic revenue growth” is a useful measure
used by the company to measure the underlying
results and trends in the business. The difference
between reported net revenue growth (the most
comparable GAAP measure) and organic revenue
growth (the non-GAAP measure) consists of the
impact from foreign currency, acquisitions and
divestitures, and other changes that do not reflect the
underlying results and trends (for example, revenue
reclassifications and changes to the fiscal year).
Organic revenue growth is a useful measure of the
company’s performance because it excludes items that:
i) are not completely under management’s control,
such as the impact of foreign currency exchange; or
ii) do not reflect the underlying growth of the company,
such as acquisition and divestiture activity, or revenue
reclassification. It is also a component of the company’s
compensation programs. The limitation of this
measure is that it excludes items that have an impact
on the company’s revenue.
“Net debt” is total debt (the most comparable GAAP
measure) minus cash and cash equivalents. Management
believes net debt is an important measure of liquidity,
which it uses as a tool to measure the company’s ability
to meet its future debt obligations. Cash and cash
equivalents are subtracted from the GAAP measure
because they could be used to reduce our debt
obligations. The limitation associated with using net
debt is that it subtracts cash items and therefore may
imply that there is less company debt than the most
comparable GAAP measure indicates and may include
certain cash items that are not readily available for
repaying debt. This limitation is best addressed by using
net debt in combination with total debt because net debt
may be significantly lower than the GAAP measure.
CAUTION CONCERNINg FORwARD-LOOkINg STATEMENTS
This report may contain certain “forward-looking statements” within the meaning of
the United States Private Securities Litigation Reform Act of 1995. These statements are
based on management’s current expectations and are subject to risks, uncertainty, and
changes in circumstances, which may cause actual results, performance, or achievements
to differ materially from anticipated results, performance, or achievements. All
statements contained herein that are not clearly historical in nature are forward-looking
and the words “anticipate,” “believe,” “expect,” “estimate,” “plan,” and similar expressions
are generally intended to identify forward-looking statements. The forward-looking
statements in this report include statements addressing the following subjects: future
financial condition and operating results. Economic, business, competitive and/or
regulatory factors affecting the Company’s businesses are examples of factors, among
others, that could cause actual results to differ materially from those described in the
forward-looking statements. The Company is under no obligation to (and expressly
disclaims any such obligation to) update or alter its forward-looking statements whether
as a result of new information, future events, or otherwise. More detailed information
about these and other factors is set forth in Tyco’s Annual Report on Form 10-K for
the fiscal year ended September 30, 2005.
NET DEBT RECONCILIATION
(Year Ended September 30, 2005)
Total debt at end of period $12,554
Less: cash and cash equivalents at end of period (3,196)
NET DEBT AT END OF PERIOD $ 9,358
FORM 10-k AND SEC AND NySE CERTIFICATI O N S
A copy of the Form 10-K filed by the Company with the Securities and Exchange
Commission (SEC) for fiscal 2005, which includes as Exhibits the Chief Executive
Officer and Chief Financial Officer Certifications required to be filed with the SEC
pursuant to Section 302 of the Sarbanes-Oxley Act, may be obtained by shareholders
without charge upon written request to Tyco International, 2nd Floor, 90 Pitts Bay
Road, Pembroke HM 08, Bermuda. The Form 10-K is also available on the Company’s
website at www.tyco.com.
The Company has filed with the New York Stock Exchange (NYSE) the Certification
of its Chief Executive Officer confirming that the Company has complied with the
NYSE corporate governance listing standards.
Design: VSA Partners, New York Photos: Chris Buck, Michael Hemberger, Corbis, Getty Images, Veer Inc. Printing: ADP Graphic Communications Printed on 30% post-consumer recycled paper.