ADT 2005 Annual Report Download - page 112
Download and view the complete annual report
Please find page 112 of the 2005 ADT annual report below. You can navigate through the pages in the report by either clicking on the pages listed below, or by using the keyword search tool below to find specific information within the annual report.-
 1
1 -
2
-
3
-
4
-
5
-
6
-
7
-
8
-
9
-
10
-
11
-
12
-
13
-
14
-
15
-
16
-
17
-
18
-
19
-
20
-
21
-
22
-
23
-
24
-
25
-
26
-
27
-
28
-
29
-
30
-
31
-
32
-
33
-
34
-
35
-
36
-
37
-
38
-
39
-
40
-
41
-
42
-
43
-
44
-
45
-
46
-
47
-
48
-
49
-
50
-
51
-
52
-
53
-
54
-
55
-
56
-
57
-
58
-
59
-
60
-
61
-
62
-
63
-
64
-
65
-
66
-
67
-
68
-
69
-
70
-
71
-
72
-
73
-
74
-
75
-
76
-
77
-
78
-
79
-
80
-
81
-
82
-
83
-
84
-
85
-
86
-
87
-
88
-
89
-
90
-
91
-
92
-
93
-
94
-
95
-
96
-
97
-
98
-
99
-
100
-
101
-
 102
102 -
 103
103 -
 104
104 -
 105
105 -
 106
106 -
 107
107 -
 108
108 -
 109
109 -
 110
110 -
 111
111 -
 112
112 -
 113
113 -
 114
114 -
 115
115 -
 116
116 -
 117
117 -
 118
118 -
 119
119 -
 120
120 -
 121
121 -
 122
122 -
123
-
124
-
125
-
126
-
127
-
128
-
129
-
130
-
131
-
132
-
133
-
134
-
135
-
136
-
137
-
138
-
139
-
140
-
141
-
142
-
143
-
144
-
145
-
146
-
147
-
148
-
149
-
150
-
151
-
152
-
153
-
154
-
155
-
156
-
157
-
158
-
159
-
160
-
161
-
162
-
163
-
164
-
165
-
166
-
167
-
168
-
169
-
170
-
171
-
172
-
173
-
174
-
175
-
176
-
177
-
178
-
179
-
180
-
181
-
182
-
183
-
184
-
185
-
186
-
187
-
188
-
189
-
190
-
191
-
192
-
193
-
194
-
195
-
196
-
197
-
198
-
199
-
200
-
201
-
202
-
203
-
204
-
205
-
206
-
207
-
208
-
209
-
210
-
211
-
212
-
213
-
214
-
215
-
216
-
217
-
218
-
219
-
220
-
221
-
222
-
223
-
224
-
225
-
226
-
227
-
228
-
229
-
230
-
231
-
232
 |
 |

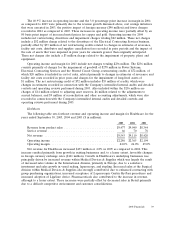
Net revenue increased $4.2 billion, or 12.1%, for 2004 as compared to 2003, which resulted from
growth in all segments. Foreign currency exchange rates favorably affected the period by $1.7 billion
while the impact of divestitures negatively impacted the period by $638 million.
Operating income increased $2.4 billion, or 82.0%, for 2004 while operating margin increased
5.2 percentage points to 13.6%. Operating income for 2004 was unfavorably impacted by charges of
$380 million, consisting of the following: (i) net restructuring and other charges of $212 million, of
which charges of $6 million are included in cost of sales; (ii) net losses and impairments on divestitures
totaling $116 million; and (iii) charges for the impairment of long-lived assets of $52 million, of which
$34 million is attributable to machinery and equipment impairments at Fire and Security. Foreign
currency exchange rates favorably affected operating income by $230 million.
Operating income for 2003 was unfavorably impacted by net charges totaling $1,625 million. These
charges consisted of: (i) charges for the impairment of long-lived assets of $815 million; (ii) charges
recorded for changes in estimates of $298 million which arose from the Company’s intensified internal
audits and detailed controls and operating reviews (includes net restructuring credits of $72 million, of
which credits of $13 million are included in costs of sales, charges for the impairment of long-lived
assets of $10 million, charges of $240 million included in selling, general and administrative expenses,
and charges of $120 million included in cost of sales); (iii) charges for the impairment of goodwill of
$278 million; (iv) other charges of $154 million, of which $34 million is included in cost of sales related
primarily to product warranty reserves and the dismantlement of customers’ ADT security systems, and
$120 million is included in selling, general and administrative expenses related primarily to uncollectible
accounts receivable, internal investigation fees, as well as severance and facility closures, slightly offset
by a credit for changes in estimates of charges recorded in prior periods; (v) a charge of $91 million for
a retroactive, incremental premium on prior period directors and officers insurance included in selling,
general and administrative expenses; and (vi) net restructuring credits of $11 million, of which charges
of $2 million are included in cost of sales. Foreign currency exchange rates favorably affected operating
income by $191 million.
Results by Geographic Area
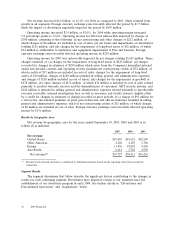
Net revenue by geographic area for the years ended September 30, 2005, 2004 and 2003 is as
follows ($ in millions):
2005 2004 2003
Net revenue:
United States ..................................... $19,635 $19,632 $18,309
Other Americas ................................... 2,202 2,103 1,786
Europe .......................................... 11,476 10,892 9,256
Asia-Pacific ...................................... 6,414 5,784 4,905
Net revenue(1) ................................... $39,727 $38,411 $34,256
(1) Revenue from external customers is attributed to individual countries based on the reporting entity that records the
transaction.
Segment Results
The segment discussions that follow describe the significant factors contributing to the changes in
results for each continuing segment. Divestitures have impacted certain of our segments since the
establishment of our divestiture program in early 2004. See further details in ‘‘Divestitures and
Discontinued Operations’’ and ‘‘Acquisitions’’ below.
36 2005 Financials