ADT 2005 Annual Report Download - page 172
Download and view the complete annual report
Please find page 172 of the 2005 ADT annual report below. You can navigate through the pages in the report by either clicking on the pages listed below, or by using the keyword search tool below to find specific information within the annual report.-
 1
1 -
2
-
3
-
4
-
5
-
6
-
7
-
8
-
9
-
10
-
11
-
12
-
13
-
14
-
15
-
16
-
17
-
18
-
19
-
20
-
21
-
22
-
23
-
24
-
25
-
26
-
27
-
28
-
29
-
30
-
31
-
32
-
33
-
34
-
35
-
36
-
37
-
38
-
39
-
40
-
41
-
42
-
43
-
44
-
45
-
46
-
47
-
48
-
49
-
50
-
51
-
52
-
53
-
54
-
55
-
56
-
57
-
58
-
59
-
60
-
61
-
62
-
63
-
64
-
65
-
66
-
67
-
68
-
69
-
70
-
71
-
72
-
73
-
74
-
75
-
76
-
77
-
78
-
79
-
80
-
81
-
82
-
83
-
84
-
85
-
86
-
87
-
88
-
89
-
90
-
91
-
92
-
93
-
94
-
95
-
96
-
97
-
98
-
99
-
100
-
101
-
102
-
103
-
104
-
105
-
106
-
107
-
108
-
109
-
110
-
111
-
112
-
113
-
114
-
115
-
116
-
117
-
118
-
119
-
120
-
121
-
122
-
123
-
124
-
125
-
126
-
127
-
128
-
129
-
130
-
131
-
132
-
133
-
134
-
135
-
136
-
137
-
138
-
139
-
140
-
141
-
142
-
143
-
144
-
145
-
146
-
147
-
148
-
149
-
150
-
151
-
152
-
153
-
154
-
155
-
156
-
157
-
158
-
159
-
160
-
161
-
 162
162 -
 163
163 -
 164
164 -
 165
165 -
 166
166 -
 167
167 -
 168
168 -
 169
169 -
 170
170 -
 171
171 -
 172
172 -
 173
173 -
 174
174 -
 175
175 -
 176
176 -
 177
177 -
 178
178 -
 179
179 -
 180
180 -
 181
181 -
 182
182 -
183
-
184
-
185
-
186
-
187
-
188
-
189
-
190
-
191
-
192
-
193
-
194
-
195
-
196
-
197
-
198
-
199
-
200
-
201
-
202
-
203
-
204
-
205
-
206
-
207
-
208
-
209
-
210
-
211
-
212
-
213
-
214
-
215
-
216
-
217
-
218
-
219
-
220
-
221
-
222
-
223
-
224
-
225
-
226
-
227
-
228
-
229
-
230
-
231
-
232
 |
 |
TYCO INTERNATIONAL LTD.
NOTES TO CONSOLIDATED FINANCIAL STATEMENTS
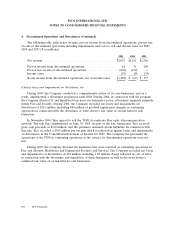
2. Restructuring and Other Charges (Credits), Net (Continued)
in carrying value of inventory and $11 million of other non-cash charges, $30 million for employee
severance and benefits, $8 million for facility exit costs and $2 million for other costs. At September 30,
2005, all actions under these plans have been completed and there are no reserves outstanding on the
Company’s Consolidated Balance Sheet.
During 2003, the Company also recorded $144 million of restructuring and other credits which
includes the reversal of restructuring reserves related to completing certain restructuring activities
announced in prior years for amounts less than originally estimated.
Restructuring and other charges (credits), net recorded by each segment were as follows:
During 2003, Fire and Security recorded restructuring charges of $26 million related to 2003
restructuring plans, including $4 million reflected in cost of sales for the non-cash write-down in
carrying value of inventory and $3 million in non-cash restructuring charges. Additionally, Fire and
Security completed certain restructuring activities announced in prior years for amounts less than
originally estimated, and accordingly reversed $16 million of restructuring reserves as a restructuring
credit.
During 2003, Electronics recorded restructuring and other credits of $72 million, including
$20 million of credits reflected in cost of sales relating to sales of certain inventory impaired in prior
years for amounts greater than originally anticipated. These restructuring credits primarily related to
severance costs being less than originally anticipated due to employee attrition and redeployment and
termination fees being less than anticipated due to negotiated settlements.
During 2003, Healthcare recorded restructuring credits of $8 million related to the completion of
restructuring activities announced in prior years for amounts less than originally anticipated.
During 2003, Engineered Products and Services recorded restructuring charges of $18 million
related to 2003 restructuring plans, including $6 million reflected in cost of sales for the non-cash
write-down in carrying value of inventory. Additionally, Engineered Products and Services recorded
$10 million of restructuring and other credits which includes the reversal of restructuring reserves
related to completing certain restructuring activities announced in prior years for amounts less than
originally estimated.
During 2003, Corporate recorded restructuring charges of $17 million related to 2003 restructuring
plans which include $8 million in non-cash charges. In addition, Corporate recorded $38 million of
restructuring and other credits which includes the reversal of restructuring reserves related to
completing certain restructuring activities announced in prior years for amounts less than originally
estimated.
96 2005 Financials