The Hartford 2011 Annual Report Download - page 91
Download and view the complete annual report
Please find page 91 of the 2011 The Hartford annual report below. You can navigate through the pages in the report by either clicking on the pages listed below, or by using the keyword search tool below to find specific information within the annual report.-
 1
1 -
2
-
3
-
4
-
5
-
6
-
7
-
8
-
9
-
10
-
11
-
12
-
13
-
14
-
15
-
16
-
17
-
18
-
19
-
20
-
21
-
22
-
23
-
24
-
25
-
26
-
27
-
28
-
29
-
30
-
31
-
32
-
33
-
34
-
35
-
36
-
37
-
38
-
39
-
40
-
41
-
42
-
43
-
44
-
45
-
46
-
47
-
48
-
49
-
50
-
51
-
52
-
53
-
54
-
55
-
56
-
57
-
58
-
59
-
60
-
61
-
62
-
63
-
64
-
65
-
66
-
67
-
68
-
69
-
70
-
71
-
72
-
73
-
74
-
75
-
76
-
77
-
78
-
79
-
80
-
 81
81 -
 82
82 -
 83
83 -
 84
84 -
 85
85 -
 86
86 -
 87
87 -
 88
88 -
 89
89 -
 90
90 -
 91
91 -
 92
92 -
 93
93 -
 94
94 -
 95
95 -
 96
96 -
 97
97 -
 98
98 -
 99
99 -
 100
100 -
 101
101 -
102
-
103
-
104
-
105
-
106
-
107
-
108
-
109
-
110
-
111
-
112
-
113
-
114
-
115
-
116
-
117
-
118
-
119
-
120
-
121
-
122
-
123
-
124
-
125
-
126
-
127
-
128
-
129
-
130
-
131
-
132
-
133
-
134
-
135
-
136
-
137
-
138
-
139
-
140
-
141
-
142
-
143
-
144
-
145
-
146
-
147
-
148
-
149
-
150
-
151
-
152
-
153
-
154
-
155
-
156
-
157
-
158
-
159
-
160
-
161
-
162
-
163
-
164
-
165
-
166
-
167
-
168
-
169
-
170
-
171
-
172
-
173
-
174
-
175
-
176
-
177
-
178
-
179
-
180
-
181
-
182
-
183
-
184
-
185
-
186
-
187
-
188
-
189
-
190
-
191
-
192
-
193
-
194
-
195
-
196
-
197
-
198
-
199
-
200
-
201
-
202
-
203
-
204
-
205
-
206
-
207
-
208
-
209
-
210
-
211
-
212
-
213
-
214
-
215
-
216
-
217
-
218
-
219
-
220
-
221
-
222
-
223
-
224
-
225
-
226
-
227
-
228
-
229
-
230
-
231
-
232
-
233
-
234
-
235
-
236
-
237
-
238
-
239
-
240
-
241
-
242
-
243
-
244
-
245
-
246
-
247
-
248
 |
 |
91
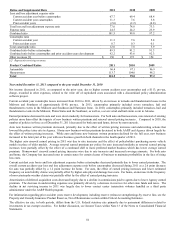
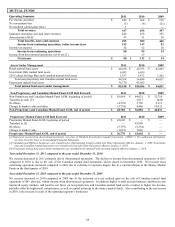
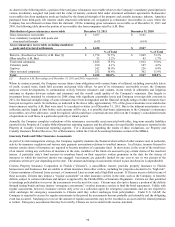
Year ended December 31, 2011 compared to the year ended December 31, 2010
Net income increased in 2011 compared to 2010 primarily due to the change in net realized capital gains (losses), offset in part by
increases in 2011 in the Unlock charge and DAC amortization resulting from assumption changes reflecting the declining performance
of the equity markets in 2011. Benefits, losses and loss adjustment expenses increased in 2011 reflecting the decline in equity market
performance however, these expenses were partially offset by the release of a reserve related to a Japan product. In addition, insurance
operating costs and other expenses increased in 2011 due to costs associated with expected assessments related to the Executive Life
Insurance Company of New York (“ELNY”) insolvency.
The net realized capital gains in 2011 compared to net realized capital losses in 2010 were primarily due to gains in the variable annuity
hedging program and lower net impairment losses. Variable annuity hedging program gains were $775 in 2011 compared to $11 in
2010; net impairment losses were $54 and $172, respectively, in 2011 and 2010. For further discussion on the results of the variable
annuity hedging program see Investment Results, Net Realized Capital Gains (Losses) within Key Performance Measures and Ratios of
the MD&A.
The Unlock charge was $244, after-tax, in 2011 compared to an Unlock charge of $78, after-tax, in 2010. The Unlock charge in 2011
was primarily a result of the impact of the annual assumption update. Including expected Japan hedging costs, and actual separate
account returns below our aggregated estimated returns. Benefits, losses and loss adjustment expenses as well as DAC amortization
increased accordingly. For further discussion of the Unlock see the Critical Accounting Estimates within the MD&A.
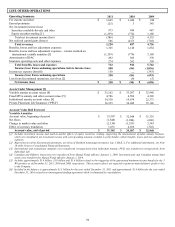
Life Other Operations effective tax rate differs from the statutory rate of 35% primarily due to varying tax rates by country and the
valuation allowance on deferred tax benefits related to certain realized losses on securities that back certain institutional annuities. For
further discussion, see Note 13 of the Notes to Consolidated Financial Statements.
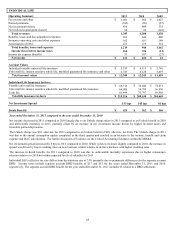
Year ended December 31, 2010 compared to the year ended December 31, 2009
Net income increased in 2010 compared to 2009 primarily due to the change in net realized capital gains (losses), a lower Unlock
charge and lower DAC amortization, as well as continued expense reduction efforts.
The Unlock charge was $78, after-tax, in 2010 compared to an Unlock charge of $318, after-tax, in 2009. The Unlock charge in 2010
was primarily due to equity market improvements that were less than expected for 2010, while the Unlock charge in 2009 was primarily
due to equity market performance significantly below expectations for the first quarter of 2009. Benefits, losses and loss adjustment
expenses, as well as DAC amortization decreased in 2010 due to the lower Unlock charge. For further discussion of the Unlock see the
Critical Accounting Estimates within the MD&A.
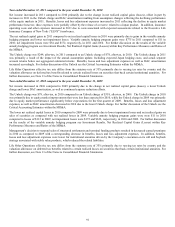
The lower net realized capital losses in 2010 compared to 2009 were primarily due to lower impairment losses and net realized gains on
sales of securities as compared with net realized losses in 2009. Variable annuity hedging program gains were were $11 in 2010
compared to losses of $112 in 2009; net impairment losses were $172 and $619, respectively, in 2010 and 2009. For further discussion
on the results of the variable annuity hedging program see Investment Results, Net Realized Capital Gains (Losses) within Key
Performance Measures and Ratios of the MD&A.
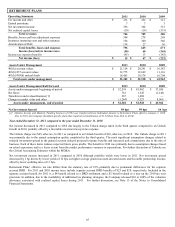
Management’ s decision to suspend sales of structured settlements and terminal funding products resulted in decreased earned premiums
in 2010 as compared to 2009 with a corresponding decrease in benefits, losses and loss adjustment expenses. In addition, benefits,
losses and loss adjustment expenses were lower for institutional annuities driven by the Company’ s execution on its call and buyback
strategy associated with stable value products, which reduced the related liabilities.
Life Other Operations effective tax rate differs from the statutory rate of 35% primarily due to varying tax rates by country and the
valuation allowance on deferred tax benefits related to certain realized losses on securities that back certain institutional annuities. For
further discussion, see Note 13 of the Notes to Consolidated Financial Statements.