The Hartford 2011 Annual Report Download - page 47
Download and view the complete annual report
Please find page 47 of the 2011 The Hartford annual report below. You can navigate through the pages in the report by either clicking on the pages listed below, or by using the keyword search tool below to find specific information within the annual report.-
 1
1 -
2
-
3
-
4
-
5
-
6
-
7
-
8
-
9
-
10
-
11
-
12
-
13
-
14
-
15
-
16
-
17
-
18
-
19
-
20
-
21
-
22
-
23
-
24
-
25
-
26
-
27
-
28
-
29
-
30
-
31
-
32
-
33
-
34
-
35
-
36
-
 37
37 -
 38
38 -
 39
39 -
 40
40 -
 41
41 -
 42
42 -
 43
43 -
 44
44 -
 45
45 -
 46
46 -
 47
47 -
 48
48 -
 49
49 -
 50
50 -
 51
51 -
 52
52 -
 53
53 -
 54
54 -
 55
55 -
 56
56 -
 57
57 -
58
-
59
-
60
-
61
-
62
-
63
-
64
-
65
-
66
-
67
-
68
-
69
-
70
-
71
-
72
-
73
-
74
-
75
-
76
-
77
-
78
-
79
-
80
-
81
-
82
-
83
-
84
-
85
-
86
-
87
-
88
-
89
-
90
-
91
-
92
-
93
-
94
-
95
-
96
-
97
-
98
-
99
-
100
-
101
-
102
-
103
-
104
-
105
-
106
-
107
-
108
-
109
-
110
-
111
-
112
-
113
-
114
-
115
-
116
-
117
-
118
-
119
-
120
-
121
-
122
-
123
-
124
-
125
-
126
-
127
-
128
-
129
-
130
-
131
-
132
-
133
-
134
-
135
-
136
-
137
-
138
-
139
-
140
-
141
-
142
-
143
-
144
-
145
-
146
-
147
-
148
-
149
-
150
-
151
-
152
-
153
-
154
-
155
-
156
-
157
-
158
-
159
-
160
-
161
-
162
-
163
-
164
-
165
-
166
-
167
-
168
-
169
-
170
-
171
-
172
-
173
-
174
-
175
-
176
-
177
-
178
-
179
-
180
-
181
-
182
-
183
-
184
-
185
-
186
-
187
-
188
-
189
-
190
-
191
-
192
-
193
-
194
-
195
-
196
-
197
-
198
-
199
-
200
-
201
-
202
-
203
-
204
-
205
-
206
-
207
-
208
-
209
-
210
-
211
-
212
-
213
-
214
-
215
-
216
-
217
-
218
-
219
-
220
-
221
-
222
-
223
-
224
-
225
-
226
-
227
-
228
-
229
-
230
-
231
-
232
-
233
-
234
-
235
-
236
-
237
-
238
-
239
-
240
-
241
-
242
-
243
-
244
-
245
-
246
-
247
-
248
 |
 |

47
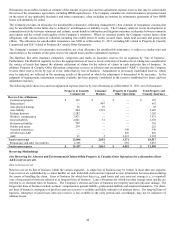
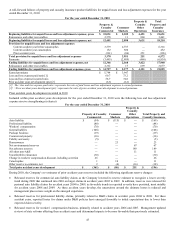
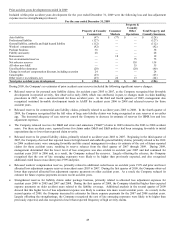
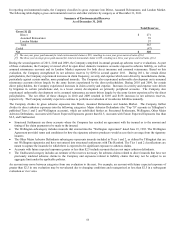
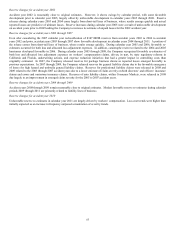
A roll-forward follows of property and casualty insurance product liabilities for unpaid losses and loss adjustment expenses for the year
ended December 31, 2010:
For the year ended December 31, 2010
Property &
Casualty
Commercial
Consumer
Markets
Property &
Casualty
Other
Operations
Total
Property and
Casualty
Insurance
Beginning liabilities for unpaid losses and loss adjustment expenses, gross
$
15,051
$
2,109
$
4,491
$
21,651
Reinsurance and other recoverables
2,570
11
860
3,441
Beginning liabilities for unpaid losses and loss adjustment expenses, net
12,481
2,098
3,631
18,210
Provision for unpaid losses and loss adjustment expenses
Current accident year before catastrophes
3,579
2,737
—
6,316
Current accident year catastrophes
152
300
—
452
Prior accident years
(361)
(86)
251
(196)
Total provision for unpaid losses and loss adjustment expenses
3,370
2,951
251
6,572
Payments
(3,485)
(2,889)
(460)
(6,834)
Ending liabilities for unpaid losses and loss adjustment expenses, net
12,366
2,160
3,422
17,948
Reinsurance and other recoverables
2,361
17
699
3,077
Ending liabilities for unpaid losses and loss adjustment expenses, gross
$
14,727
$
2,177
$
4,121
$
21,025
Earned premiums
$
5,744
$
3,947
Loss and loss expense paid ratio [1]
60.7
73.2
Loss and loss expense incurred ratio
58.7
74.8
Prior accident years development (pts) [2]
(6.3)
(2.2)
[1] The “loss and loss expense paid ratio” represents the ratio of paid losses and loss adjustment expenses to earned premiums.
[2] “Prior accident years development (pts)” represents the ratio of prior accident years development to earned premiums.
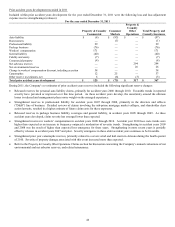
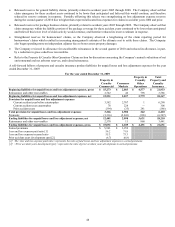
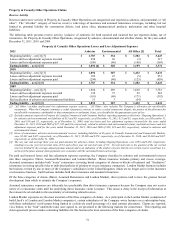
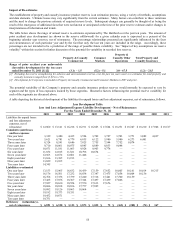
Prior accident years development recorded in 2010
Included within prior accident years development for the year ended December 31, 2010 were the following loss and loss adjustment
expense reserve strengthenings (releases):
For the year ended December 31, 2010
Property & Casualty
Commercial
Consumer
Markets
Property &
Casualty
Other
Operations
Total Property and
Casualty Insurance
Auto liability
$
(54)
$
(115)
$
—
$
(169)
Professional liability
(88)
—
—
(88)
Workers’ compensation
(70)
—
—
(70)
General liability
(108)
—
—
(108)
Package business
(19)
—
—
(19)
Commercial property
(16)
—
—
(16)
Fidelity and surety
(5)
—
—
(5)
Homeowners
—
23
—
23
Net environmental reserves
—
—
67
67
Net asbestos reserves
—
—
189
189
All other non-A&E
—
—
11
11
Uncollectible reinsurance
(30)
—
—
(30)
Change in workers' compensation discount, including accretion
26
—
—
26
Catastrophes
1
10
—
11
Other reserve re-estimates, net
2
(4)
(16)
(18)
Total prior accident years development
$
(361)
$
(86)
$
251
$
(196)
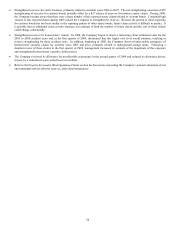
During 2010, the Company’ s re-estimates of prior accident years reserves included the following significant reserve changes:
• Released reserves for commercial auto liability claims as the Company lowered its reserve estimate to recognize a lower severity
trend during 2009 that continued into 2010 on larger claims in accident years 2002 to 2009. In addition, reserves were released for
personal auto liability claims for accident years 2004 to 2009, as favorable trends in reported severity have persisted, most notably
for accident years 2008 and 2009. As these accident years develop, the uncertainty around the ultimate losses is reduced and
management places more weight on the emerged experience.
• Released reserves for professional liability claims, primarily related to D&O claims in accident years 2004 to 2008. For these
accident years, reported losses for claims under D&O policies have emerged favorably to initial expectations due to lower than
expected claim severity.
• Released reserves for workers’ compensation business, primarily related to accident years 2006 and 2007. Management updated
reviews of state reforms affecting these accident years and determined impacts to be more favorable than previously estimated.