The Hartford 2011 Annual Report Download - page 75
Download and view the complete annual report
Please find page 75 of the 2011 The Hartford annual report below. You can navigate through the pages in the report by either clicking on the pages listed below, or by using the keyword search tool below to find specific information within the annual report.-
 1
1 -
2
-
3
-
4
-
5
-
6
-
7
-
8
-
9
-
10
-
11
-
12
-
13
-
14
-
15
-
16
-
17
-
18
-
19
-
20
-
21
-
22
-
23
-
24
-
25
-
26
-
27
-
28
-
29
-
30
-
31
-
32
-
33
-
34
-
35
-
36
-
37
-
38
-
39
-
40
-
41
-
42
-
43
-
44
-
45
-
46
-
47
-
48
-
49
-
50
-
51
-
52
-
53
-
54
-
55
-
56
-
57
-
58
-
59
-
60
-
61
-
62
-
63
-
64
-
 65
65 -
 66
66 -
 67
67 -
 68
68 -
 69
69 -
 70
70 -
 71
71 -
 72
72 -
 73
73 -
 74
74 -
 75
75 -
 76
76 -
 77
77 -
 78
78 -
 79
79 -
 80
80 -
 81
81 -
 82
82 -
 83
83 -
 84
84 -
 85
85 -
86
-
87
-
88
-
89
-
90
-
91
-
92
-
93
-
94
-
95
-
96
-
97
-
98
-
99
-
100
-
101
-
102
-
103
-
104
-
105
-
106
-
107
-
108
-
109
-
110
-
111
-
112
-
113
-
114
-
115
-
116
-
117
-
118
-
119
-
120
-
121
-
122
-
123
-
124
-
125
-
126
-
127
-
128
-
129
-
130
-
131
-
132
-
133
-
134
-
135
-
136
-
137
-
138
-
139
-
140
-
141
-
142
-
143
-
144
-
145
-
146
-
147
-
148
-
149
-
150
-
151
-
152
-
153
-
154
-
155
-
156
-
157
-
158
-
159
-
160
-
161
-
162
-
163
-
164
-
165
-
166
-
167
-
168
-
169
-
170
-
171
-
172
-
173
-
174
-
175
-
176
-
177
-
178
-
179
-
180
-
181
-
182
-
183
-
184
-
185
-
186
-
187
-
188
-
189
-
190
-
191
-
192
-
193
-
194
-
195
-
196
-
197
-
198
-
199
-
200
-
201
-
202
-
203
-
204
-
205
-
206
-
207
-
208
-
209
-
210
-
211
-
212
-
213
-
214
-
215
-
216
-
217
-
218
-
219
-
220
-
221
-
222
-
223
-
224
-
225
-
226
-
227
-
228
-
229
-
230
-
231
-
232
-
233
-
234
-
235
-
236
-
237
-
238
-
239
-
240
-
241
-
242
-
243
-
244
-
245
-
246
-
247
-
248
 |
 |

75
Variable
annuity hedge
program
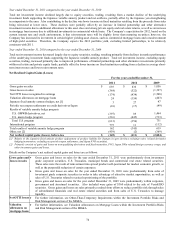
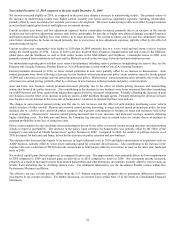
• For the year ended December 31, 2011, the loss on U.S. GMWB related derivatives, net, was primarily due to a
decrease in long-term interest rates that resulted in a charge of ($283) and a higher interest rate volatility that
resulted in a charge of ($84). The loss on U.S. macro hedge program for the year ended December 31, 2011
was primarily driven by time decay and a decrease in equity market volatility since the purchase date of certain
options during the fourth quarter. The gain associated with the international program for the year ended
December 31, 2011 was primarily driven by the Japanese yen strengthening, lower global equity markets, and a
decrease in interest rates.
• For the year ended December 31, 2010, the gain on U.S. GMWB derivatives, net, was primarily due to liability
model assumption updates of $159 and lower implied market volatility of $118, and outperformance of the
underlying actively managed funds as compared to their respective indices of $104, partially offset by losses
due to a general decrease in long-term rates of ($158) and rising equity markets of ($90). The net loss on the
U.S. macro hedge program was primarily the result of a higher equity market valuation and the impact of
trading activity.
• For the year ended December 31, 2009, the gain on GMWB derivatives, net, was primarily due to liability
model assumption updates related to favorable policyholder experience of $566, the relative outperformance of
the underlying actively managed funds as compared to their respective indices of $550, and the impact of the
Company’ s own credit standing of $154. Additional net gains of $56 resulted from lower implied market
volatility and a general increase in long-term interest rates, partially offset by rising equity markets. The net
loss on the U.S. macro hedge program was primarily the result of a higher equity market valuation.
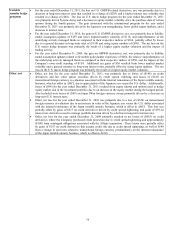
Other, net
• Other, net loss for the year ended December 31, 2011, was primarily due to losses of ($148) on credit
derivatives and fair value option securities driven by credit spread widening and losses of ($141) on
transactional foreign currency re-valuation associated with the internal reinsurance of the Japan variable annuity
business, which is offset in AOCI, due to appreciation of the Japanese yen versus the U.S. dollar. Additionally,
losses of ($94) for the year ended December 31, 2011 resulted from equity futures and options used to hedge
equity market risk in the investment portfolio due to an increase in the equity market during the hedged period.
Also included were losses of ($69) on Japan 3Win foreign currency swaps primarily driven by a decrease in
long-term U.S. interest rates.
• Other, net loss for the year ended December 31, 2010 was primarily due to a loss of ($326) on transactional
foreign currency re-valuation due to an increase in value of the Japanese yen versus the U.S. dollar associated
with the internal reinsurance of the Japan variable annuity business, which is offset in AOCI. This loss was
partially offset by gains of $217 on credit derivatives driven by credit spread tightening, and gains of $59 on
interest rate derivatives used to manage portfolio duration driven by a decline in long-term interest rates.
• Other, net loss for the year ended December 31, 2009 primarily resulted in net losses of ($463) on credit
derivatives where the Company purchased credit protection due to credit spread tightening and approximately
($300) from contingent obligations associated with the Allianz transaction. These losses were partially offset
by gains of $155 on credit derivatives that assume credit risk due to credit spread tightening, as well as $140
from a change in spot rates related to transactional foreign currency predominately on the internal reinsurance
of the Japan variable annuity business, which is offset in AOCI.